Interactive Data Structures Visualizer
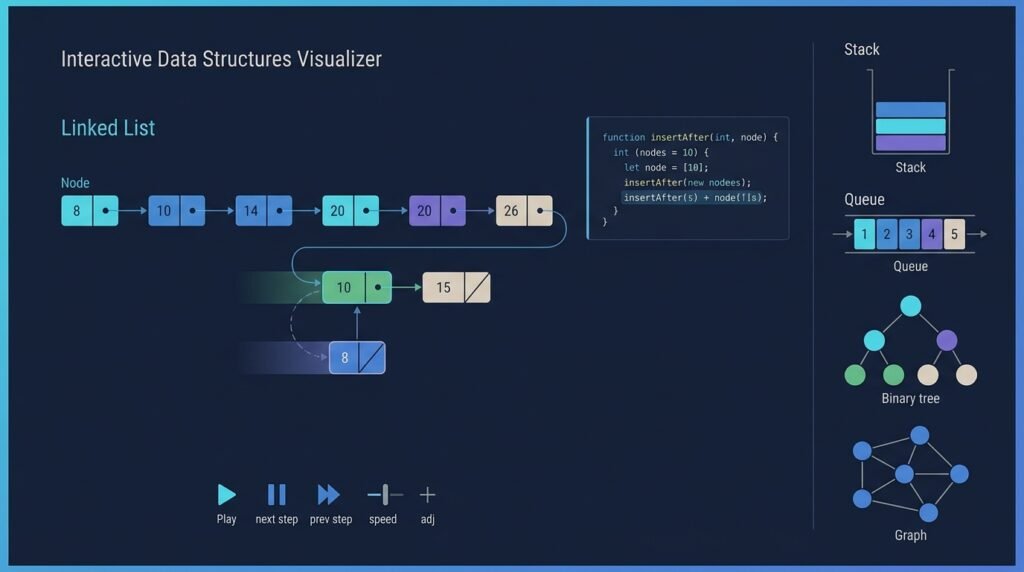
An educational web application that lets students watch data structures in action. Pick a structure — an array, linked list, stack, queue, tree, graph, or hash table — choose an operation, and step through it one move at a time with the code that implements it shown alongside. The goal is understanding, not production engineering: this is a learning instrument, deliberately kept simple and readable.
Who Is This For?
- CS students preparing for exams or interviews who want to see how operations behave
- Self-learners working through data-structures material without an instructor
- Instructors who want a shareable, interactive demo for lectures and labs
- Programming beginners who have met arrays and want to understand what’s happening under the hood
The Problem
Textbooks describe data structures with static diagrams and prose. A linked-list diagram tells you a node points to the next node, but it doesn’t show the moment of the pointer reassignment, or what happens when you delete a node in the middle of a list. Learners who can’t visualize the moving parts often memorize patterns instead of understanding them — and that understanding gap shows up at exam time and in interviews.
Watching a structure mutate step by step, with the code for each step visible, turns an abstract rule (“prepend is O(1) for a linked list”) into something you can see happen. That’s the gap this project fills: not another diagram, but a playable structure.
How It Works
The app is organized around three layers: structure models, an operation engine, and a playback view.
1. Structure Models
Each data structure is implemented as a plain, readable JavaScript class — a real linked list, a real binary search tree, a real hash table. They are written to be clear rather than fast: meaningful variable names, comments, and no clever one-liners. These are teaching implementations, not production-grade ones.
2. Operation Engine
Every mutating or querying operation (insert, delete, search, push, pop, rotate, rebalance) runs through a small recorder. The recorder captures each primitive step — “pointer now points to node B”, “element moved to index 2”, “node marked visited” — as a discrete event with an explanation string.
3. Playback View
The view renders the structure’s current state and plays the recorded steps:
- Step — advance one event at a time
- Play / Pause — run through the operation continuously
- Reset — restore the initial state
- Speed control — slow down for classroom demos
- Code highlight — the line of code responsible for the current step lights up in the side panel
┌─────────────────────┐ events ┌──────────────────────┐ │ Operation Engine │───────────▶│ Playback View │ │ insert(3) on BST │ │ tree canvas + code │ │ + step recorder │ │ panel + step controls│ └─────────────────────┘ └──────────────────────┘ │ │ ▼ ▼ ┌─────────────────────┐ ┌──────────────────────┐ │ Teaching models │ │ Complexity notes │ │ (readable classes) │ │ best/worst/avg per │ └─────────────────────┘ │ operation │ └──────────────────────┘
Core Workflow
Choose a structure (linked list, stack, queue, binary search tree, graph, hash table, array operations).Pick or construct an input (e.g., insert values 5, 3, 8 into a BST).Choose an operation (insert, delete, search, traverse).Step through it: watch the structure change, read the explanation, see the code highlight.Check the complexity notes for best/average/worst cases.Key Features
- Step-through animation for every supported operation
- Code correspondence — the current line of implementation highlights as the state changes
- Complexity annotations — best/average/worst case shown per operation
- User-controlled inputs — build your own arrays, lists, trees, or graphs
- Playback controls — step, play, pause, reset, and speed
- Shareable states — a link (encoded state) that lets an instructor hand a specific scenario to students
- Keyboard accessible — all controls operable without a mouse
Functional Requirements
Implement readable teaching models for at least: array ops, singly linked list, stack, queue, binary search tree, graph (BFS/DFS), and hash table (chaining).Record operations as discrete, explainable steps.Render the current state of each structure (nodes, edges, indexes, pointers) on a canvas.Highlight the implementing code line for the current step.Provide step/play/pause/reset/speed controls, keyboard-operable.Accept user input (values, operations, custom sequences).Show complexity notes per operation.Encode and restore the current scenario from the URL.Fail gracefully with clear messages on invalid inputs (duplicates in a BST demo, empty-pop, etc.).User Stories
- As a student, I want to insert nodes into a tree one step at a time, so that I finally understand why rotations happen.
- As an instructor, I want to share a prepared scenario with my class, so that everyone starts from the same state.
- As a self-learner, I want the code highlighted as the structure changes, so that I connect the implementation to the behavior.
MVP Scope
Three structures: singly linked list, binary search tree, and stack/queue.Step recorder with explanations and code highlighting.Step/play/pause/reset/speed controls.Basic user input (insert/delete/search values).Complexity notes per operation.Shareable state via URL.Graphs, hash tables, array-sorting visualizations, and multi-language code views are natural second-phase additions.
Project Timeline
- Phase 1 — Research (Week 1): Survey existing visualizers (VisuAlgo, visualgo-style tools), pick the interaction model, and define the step-event schema.
- Phase 2 — MVP (Weeks 2–4): Linked list + BST models, recorder, canvas rendering, and playback controls.
- Phase 3 — Testing (Week 5): Operation correctness tests, accessibility pass, and manual classroom-style testing.
- Phase 4 — Deployment (Week 6): Deploy as a static site; add CI and basic analytics (privacy-respecting).
- Phase 5 — Improvements (Ongoing): Graph/hash-table views, share links, keyboard shortcuts, and educator feedback.
Testing Strategy
- Model tests — each teaching implementation is tested against reference behavior (insert/delete/search invariants).
- Recorder tests — replaying recorded steps reproduces the final state.
- State-integrity tests — the URL-encoded state round-trips exactly.
- Accessibility tests — controls reachable and labeled; animations have a reduced-motion fallback.
- Manual smoke test — a guided walkthrough of each structure’s operations in the browser.
Deployment Considerations
- Ship as a static site (no backend) so it is cheap to host and fast to load.
- Lazy-load heavy structure views so the initial bundle stays small.
- Keep the app usable offline once loaded (service worker in a later phase).
- Document supported browsers and test on mobile viewports.
Accessibility Considerations
- All controls keyboard-operable with visible focus.
- Animations respect
prefers-reduced-motion — stepping remains available, continuous play is optional. - Step explanations are rendered as text, not only as visual changes, so screen-reader users get the same information.
- Color is not the only signal: pointer changes, highlights, and text labels accompany color cues.
Success Metrics
- Completeness: every listed operation covered by the step recorder.
- Correctness: model tests pass; recorded replays reproduce expected end states.
- Engagement (for a deployed site): time on page, steps advanced per session, and returning visits.
- Educational usefulness (qualitative): instructor and student feedback from classroom use — not a claim of measurable grade improvement.
Common Challenges
- Step granularity — too coarse steps skip the interesting moment; too fine steps bore the viewer. Finding the right granularity takes iteration.
- Layout — trees and graphs grow unpredictably; a simple layered or radial layout with collision avoidance is enough for teaching.
- Code highlighting — keeping the highlight aligned with the exact step requires mapping each recorder event to a source line.
- Scope creep — it is tempting to add every structure; the MVP discipline keeps the code readable, which is the product.
Learning Objectives
- Implement the core data structures from scratch in a readable style.
- Understand how each operation mutates state — pointer by pointer, index by index.
- Connect operations to complexity: why prepending to a linked list is O(1) while appending to a dynamic array is amortized O(1).
- Practice event-driven UI design and canvas rendering.
- Practice accessibility-first UI development.
Why This Idea Is Different
Existing visualizers are either heavy one-off tools (VisuAlgo-style sites you can’t extend) or diagram generators that show a static picture. This project is a teaching implementation you write yourself: the value is not just the animation, it’s building the models and the recorder — which is exactly the practice a student needs. The explicit educational framing (readable code, step explanations, complexity notes, shareable scenarios) distinguishes it from a generic “draw a linked list” tool.
It deliberately makes no claims about improving grades or learning outcomes — it is a well-built study instrument, and the article presents it as such. It is a sibling of other learning tools on this site: the AI study companion for CS students helps you learn by asking and explaining, the automated code review for student submissions gives feedback on your code, and this project gives you a workspace to watch algorithms behave.
| Tool type | Approach | Limitation |
|———–|———-|————|
| Visualgo / VisuAlgo-style sites | Prebuilt animations for many structures | Closed source; you can’t see or change the implementations |
| Static diagram generators | Draw a structure as an image | No animation, no interaction |
| IDE debuggers | Show real memory state | Overwhelming detail for beginners; no teaching narrative |
| Educational videos | Narrated walkthroughs | Not interactive; can’t follow your own inputs |
This project’s differentiator: a readable, extendable implementation you build, with step-by-step operation playback and code correspondence.
Technology Stack
- React — UI and playback controls
- TypeScript — typed teaching models and recorder events
- Canvas API or SVG — structure rendering (SVG is simpler for trees/graphs)
- Vitest — model and recorder tests
- Vite — build tooling for a fast static site
Future Enhancements
- Graph and hash-table views with the same recorder
- Array-sorting visualizations (bubble, merge, quick) with comparisons highlighted
- Multi-language code views (Python/Java alongside JavaScript)
- Instructor accounts with saved lesson sequences (later phase, opt-in)
- Offline support via a service worker
- Keyboard-first “practice mode” — the app picks operations and the student predicts the outcome
Browse more Education ideas · Project Ideas