Satellite Land-Cover Explorer with EuroSAT Classification
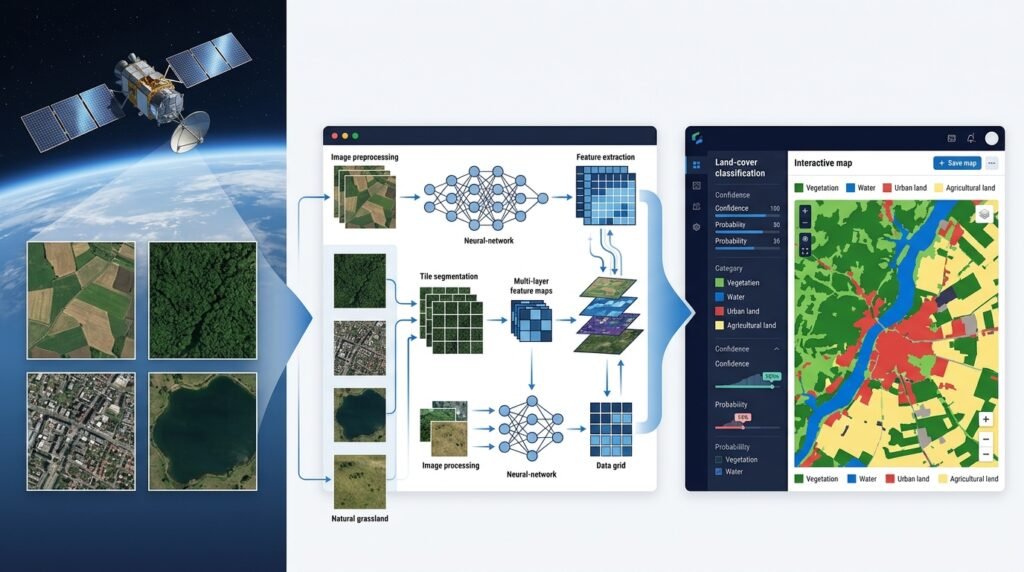
A remote-sensing project that classifies Sentinel-2 satellite image patches into land-cover categories — forests, rivers, farmland, urban areas, and more — using a fine-tuned convolutional neural network trained on the EuroSAT dataset. The finished project is an explorer: select or upload a satellite patch, get a predicted land-cover class with a confidence score, and browse per-class results and misclassifications to understand where the model struggles. The workflow is the classic image-classification pipeline — dataset inspection, preprocessing, splitting, augmentation, transfer learning, evaluation — applied to orbital imagery instead of ground-level photos.
>A learning classifier, not a land survey. A model output is a statistical guess based on the patches it was trained on; it can be wrong, and it should never be treated as an authoritative land-use survey, a land-registry record, or a policy input. This project classifies pixels for study and exploration — it does not certify land use, detect legal changes, or support enforcement decisions.
Who Is This For?
- GIS learners and geography students who want a hands-on path from raw satellite pixels to a trained, explainable classifier
- Sustainability and environmental analysts exploring what free Copernicus imagery can (and cannot) tell them about land cover
- Developers who want a remote-sensing-flavored computer-vision project with a complete, honest evaluation story
- Educators looking for a self-contained earth-observation lab that runs on a laptop
The Problem
Land-cover information — where the forests, croplands, water bodies, and built-up areas are — underpins environmental monitoring, urban planning, and climate research. But the standard path to producing it runs through expensive GIS software, specialist imagery licences, and workflows that assume you already know the domain. Meanwhile, the European Union’s Copernicus programme publishes Sentinel-2 satellite imagery openly and for free, and the EuroSAT dataset packages thousands of labeled patches from it. What’s missing is a buildable bridge: a project that takes a learner from “Sentinel-2 patches exist” to “I trained a classifier, I know its per-class strengths and weaknesses, and I can explore its predictions patch by patch.” That bridge teaches both computer vision and the remote-sensing habit of questioning what an orbital sensor can actually resolve.
How It Works
The project follows a staged pipeline. Each stage has a clear input, a clear output, and a reason to exist — resist the urge to jump straight to model training, because remote-sensing data has quirks (spectral bands, atmospheric effects, geographic bias) that punish skipping steps.
1. Get and Inspect the Dataset
EuroSAT packages Sentinel-2 image patches covering 13 spectral bands in 10 land-cover classes (such as AnnualCrop, Forest, HerbaceousVegetation, Highway, Industrial, Pasture, PermanentCrop, Residential, River, and SeaLake), with an RGB version for quick starts and a multispectral version for the full experience. Download the version you want to support, then inspect before modeling: class counts, image statistics per band, per-class examples in a contact sheet, and pixel-value distributions. Inspection is where you notice that classes are not perfectly balanced and that some classes (River vs SeaLake, AnnualCrop vs Pasture) are visually and spectrally closer than others — which is exactly where your confusion matrix will light up later.
2. Preprocess and Split
Normalize pixel values per band (record the training-set statistics and reuse them everywhere). Decide your band strategy early: the RGB subset keeps the pipeline beginner-friendly, while selected multispectral bands (for example adding the near-infrared band, which separates vegetation from look-alikes far better than visible light) teach the genuinely remote-sensing lesson that spectral bands carry the signal. Split the data into train/validation/test partitions with a fixed random seed, checking that every class is represented proportionally in each partition. For an added stretch, split by geographic neighborhood rather than pure random — it is a harder, more honest test of generalization.
3. Augment — Within Physical Reason
Standard augmentations (flips, 90°/180°/270° rotations) are physically valid for top-down satellite patches: a forest rotated 90° is still a forest. Color-space jitter, by contrast, can distort the spectral signal that distinguishes classes, so treat it cautiously and document what you applied. Augmentation should enlarge the effective training set, not fabricate spectral relationships that do not exist.
4. Train a Baseline, Then Transfer Learning
Start with a small CNN trained from scratch on your normalized patches. This baseline calibrates your expectations and usually already performs surprisingly well on the RGB subset — which is itself a finding worth reporting. Then fine-tune a pre-trained backbone (ResNet-family or EfficientNet-family models are the usual choices) for the comparison. Adapting a backbone pre-trained on ground-level photos to top-down orbital imagery is a small but real domain shift, and observing how much (or how little) fine-tuning helps is one of the project’s best teaching moments.
5. Evaluate Honestly
Report per-class precision, recall, and F1 — not just overall accuracy — plus a confusion matrix. In EuroSAT-style data the interesting failures are systematic: rivers confused with lakes, annual crops confused with pastures, highways confused with industrial areas. A confusion matrix turns those failures into a map of what the sensor and the model cannot separate, which is far more valuable than a single accuracy number. Never publish an accuracy claim you have not measured yourself on your own test split.
6. Predict with Confidence
For a new patch, output the predicted class plus a confidence score (the model’s softmax probability for the top class, ideally calibrated). Present low-confidence predictions as what they are: a signal that the patch is near a class boundary or unlike anything the model trained on. Confidence display is the honesty layer that keeps this an exploration tool rather than an oracle.
7. Build the Explorer
The deliverable that makes this a project and not a notebook: a small application (a Streamlit app is enough) where a user selects or uploads a patch, sees the prediction, confidence, and the top-3 classes, and can browse a gallery of misclassified patches per class. The explorer is also your best debugging tool — misclassification galleries expose data problems that metrics alone hide.
Key Features
- Patch classification into 10 land-cover classes with a predicted class and confidence score
- RGB and multispectral support — start simple, then add spectral bands and measure the difference
- Per-class evaluation dashboard — precision, recall, F1, and a rendered confusion matrix
- Misclassification gallery — browse where and how the model fails, per class
- Top-3 predictions display — because land-cover boundaries are genuinely fuzzy
- Reproducible pipeline — fixed seeds, recorded normalization statistics, one-command retraining
Functional Requirements
- Load and preprocess EuroSAT patches (RGB or multispectral) with per-band normalization
- Train and compare a from-scratch baseline CNN and a fine-tuned transfer-learning model
- Produce a full evaluation report: accuracy, per-class precision/recall/F1, confusion matrix
- Serve predictions for individual patches with confidence and top-3 classes
- Provide an interactive explorer UI for single-patch inference and misclassification browsing
- Export a model card documenting data version, preprocessing, training configuration, and measured results
User Stories
- As a geography student, I want to see a satellite patch classified with a confidence score so I can study which land covers the model separates well.
- As an educator, I want a one-command training run with a fixed seed so every student gets comparable results.
- As an analyst, I want per-class metrics so I know which land-cover classes I can trust the model on.
- As a developer, I want a misclassification gallery so I can decide what data or features to add next.
- As a curious learner, I want to add the near-infrared band and see whether vegetation classes become easier to separate.
MVP Scope
A minimal but complete MVP:
Load the EuroSAT RGB subset; inspect and visualize class distributionsNormalize, split (train/validation/test with a fixed seed), and apply flip/rotation augmentationTrain one transfer-learning model (fine-tuned ResNet-family backbone)Evaluate on the test split: overall accuracy, per-class precision/recall/F1, confusion matrixA Streamlit explorer: select a patch → predicted class + confidence + top-3 → misclassification galleryExplicitly out of MVP: multispectral input, geographic splits, model ensembling, tiling of full Sentinel-2 scenes, and any real-world scene ingestion. All are natural extensions, not MVP obligations.
Project Timeline
- Week 1: dataset acquisition, inspection, preprocessing, splits
- Week 2: baseline CNN; augmentation; first honest evaluation
- Week 3: transfer-learning model; per-class metrics; confusion analysis
- Week 4: Streamlit explorer; misclassification gallery; model card; polish
Testing Strategy
- Data tests: class counts per split, no train/test leakage, normalization statistics recorded and reused
- Model tests: metrics reproduce within a small tolerance under a fixed seed; per-class metrics computed against the same held-out split
- UI tests: explorer renders predictions for sample patches; gallery shows only genuinely misclassified items from the test split
- Regression guard: snapshot a small set of test patches and their predictions; retraining should not silently change them without a documented reason
Security and Privacy Considerations
- EuroSAT patches are derived from openly licensed Sentinel-2 data — keep the licence text with the dataset and respect the source attribution
- Satellite imagery can carry geographic and temporal limitations; document the dataset’s coverage and date range so downstream users do not over-generalize
- If you later extend to user-uploaded imagery, validate file types and sizes, and do not promise to geolocate or identify private properties
- Keep the model card honest about coverage — the fastest way to misuse a land-cover model is to forget where its training data came from
Success Metrics
- A trained model with a measured, reproducible test-split evaluation (your own numbers, not borrowed ones)
- Per-class F1 reported for all 10 classes, with the confusion matrix rendered and discussed
- The explorer serves single-patch predictions interactively with confidence and top-3 classes
- The model card completely describes data, preprocessing, and limitations
- A retraining run from a clean checkout reproduces the reported metrics
Common Challenges
- Class confusion between spectrally similar covers — rivers vs lakes, annual vs permanent crops; analyze failures rather than tuning them away silently
- Spectral-band temptation — adding all 13 bands without normalization care can hurt; change one thing at a time
- Domain shift from pre-training — backbones trained on ground-level photos need adaptation for top-down imagery; expect to unfreeze more layers than usual
- Random-split overconfidence — random splits scatter geographically neighboring patches across train and test; consider geographic splits for a harder, more honest estimate
- Atmospheric and seasonal effects — cloud, haze, and season change spectral signatures; the dataset is a snapshot, not an all-conditions guarantee
Learning Objectives
- Understand what Sentinel-2 imagery is and how spectral bands encode land-cover information
- Build a complete remote-sensing classification pipeline: inspection, preprocessing, splitting, augmentation, transfer learning, evaluation
- Read a confusion matrix as a map of systematic sensor/model limitations, not just a scorecard
- Practice honest evaluation: per-class metrics, no unmeasured claims, uncertainty surfaced in the UI
- Document a model with a card that a domain stranger can actually use
Why This Idea Is Different
This project classifies satellite imagery from orbit, and it is deliberately distinct from the site’s ground-level computer-vision projects. The Crop Disease Detection with Computer Vision project classifies close-up photos of plant leaves to triage crop disease — same CV foundation, entirely different subject (agricultural leaves vs terrain classes), different data (field photos vs Sentinel-2 patches), and different decisions supported (which plants to inspect vs how land cover is distributed). The AI-Powered Campus Attendance via Facial Recognition project classifies people, not terrain. And the Air Quality Prediction & Pollution Hotspot Mapper forecasts pollution values over space and time — a geospatial time-series job, not an image-classification job. #056’s job is orbital land-cover classification: pixels from space, terrain classes as labels, and an explorer for studying where the model is confident and where it is not.
| Tool type | Approach | Limitation |
|———–|———-|————|
| Professional GIS suites | Full EO workflows with specialist tooling | Expensive, steep learning curve, not learner-oriented |
| Research land-cover models | Large models from EO labs | Not inspectable or rebuildable by a student |
| Generic image classifiers | Pre-trained models applied to arbitrary images | No land-cover training, no spectral awareness, no honest reporting |
| Manual photo interpretation | Human experts read imagery | Slow, unscalable, inconsistent |
This project’s differentiators: a student-buildable end-to-end pipeline on free Copernicus-derived data, per-class evaluation with confusion analysis, a confidence-aware exploration boundary, and an explicit not-a-land-survey rule.
Technology Stack
- Python — the whole pipeline
- PyTorch or TensorFlow/Keras — models and training loop
- Pre-trained backbone (ResNet or EfficientNet family) — transfer learning
- torchvision / PIL / rasterio (if multispectral) — image loading and preprocessing
- pandas + matplotlib + scikit-learn — metrics, confusion matrix, charts
- Streamlit — the explorer UI
Future Enhancements
- Multispectral input with a measured before/after comparison against RGB
- Geographic train/test splits as the default honesty benchmark
- Scene-level inference: tile a full Sentinel-2 scene and mosaic predictions into a land-cover map
- Temporal comparison: classify the same area across seasons and visualize the change
- Active-learning loop: send low-confidence patches to a human labeler and retrain
Browse more Project Ideas · Intermediate Ideas