ETL Pipeline Visual Debugger
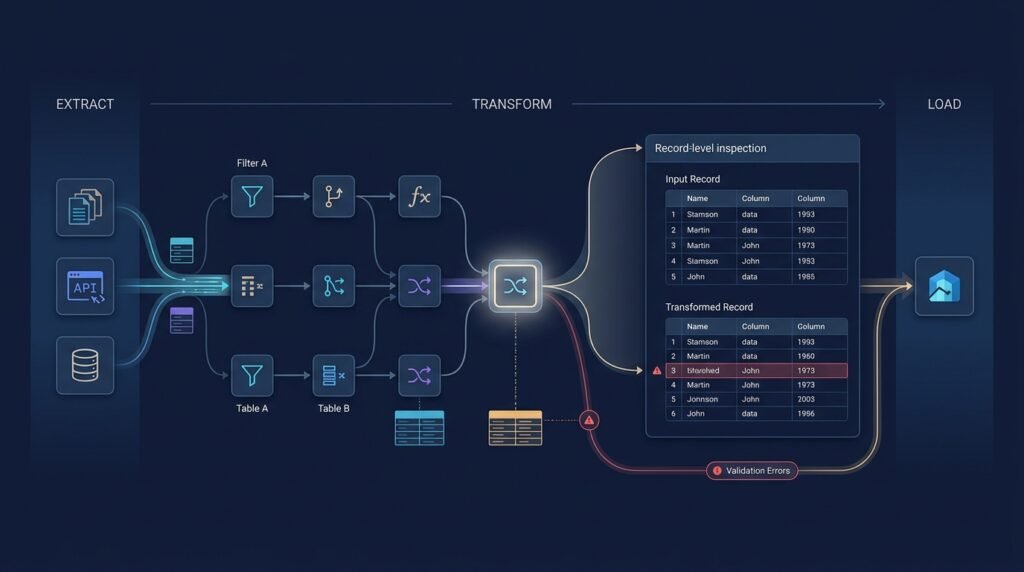
A visual debugging environment for Extract–Transform–Load pipelines. Instead of reading logs and guessing where a pipeline failed, you open the pipeline graph, pick a record, and trace it step by step through every stage — watching what each transform did, where the schema changed, and exactly where a record was rejected. It is a debugging tool for data engineers, deliberately scoped to a defined integration target rather than promising universal compatibility with every ETL platform.
Who Is This For?
- Data engineers who maintain pipelines and spend hours tracking down why records fail
- Analytics engineers who own transformations and want to see what their SQL or Python steps actually do to data
- Students learning ETL who want to watch a pipeline run record-by-record instead of trusting black boxes
- Data platform teams that want pipeline debugging to be a first-class, reproducible activity
The Problem
When an ETL pipeline fails, the symptoms are clear but the cause is buried. A downstream report shows nulls where numbers should be; a warehouse table has rows that shouldn’t exist; a load step rejects 3% of records and nobody knows why. The standard debugging workflow is painful: read the last log lines, guess the failing step, add print statements, re-run the whole pipeline, wait, repeat.
The deeper issue is that ETL failures are record-level and step-local. A transform that works for 97% of records may silently mangle the other 3%. Pipeline logs tell you a step failed; they rarely tell you which record and what happened to it. Monitoring tools (covered elsewhere on this site) alert you that something is wrong; this tool exists to show you where and why, record by record.
How It Works
The tool is built around a pipeline graph and a record replay engine.
1. Pipeline Graph
The tool loads a pipeline definition and renders each stage as a node: sources (CSV files, API calls, database tables), transforms (cleaning, parsing, enrichment, aggregation), validation rules, and the load target. Stages connect in order, and the graph shows metadata at each node — row counts in and out, schema snapshot, and any failures.
2. Record Replay Engine
This is the core idea. The user picks a record (or a batch of records) and replays it through the graph:
- each stage shows the record’s input and output side by side
- schema changes are highlighted (a column renamed, a type cast, a field dropped)
- validation failures show the exact rule that rejected the record
- rejected records are quarantined with the reason and stage
- a breakpoint pauses the replay at a chosen stage so the user can inspect state
The replay runs on captured samples, not by re-running the live pipeline: the tool records representative input, per-stage intermediate results, and final output during a normal run, then lets the engineer replay and inspect without touching production systems.
3. Evidence and Logs
Every stage keeps its logs attached to the graph node. The tool correlates stage logs with the records they affected, so “step 4 failed” becomes “step 4 failed on these 12 records, here is the input, here is the error, here is the violating value.”
[CSV source] → [clean] → [parse dates] → [validate] → [load to warehouse] 1000 rows 998 rows 997 rows 985 rows 985 rows schema: date_str → date ↑ 3 rows: invalid format (evidence attached)
Core Workflow
Connect — point the tool at a captured pipeline run (sample records + stage metadata + logs).Inspect — view the graph, row counts, and schema snapshots per stage.Trace — pick a record and replay it through the stages.Break — pause at a stage and examine the record’s intermediate state.Fix — identify the failing rule or transform, then re-run the pipeline and compare.Key Features
- Pipeline graph with per-stage row counts, schema snapshots, and failures
- Record-level lineage — follow any record through every stage
- Step-by-step replay with breakpoints
- Schema-change highlighting — see exactly where columns and types change
- Validation-failure details — the exact rule and the violating value
- Rejected-record quarantine — with reason and stage attached
- Sample-based replay — no need to re-run the live pipeline
- Correlated logs — stage logs attached to the records they affected
- Reproducible sessions — a debugging session can be saved and shared
Functional Requirements
Load a pipeline definition for the MVP integration target (see below) and render its stages as a graph.Capture during a run: sample input rows, per-stage intermediate results, schema snapshots, validation results, rejected records, and stage logs.Replay any sample record through the stages with input/output per stage.Highlight schema changes (column adds/renames/drops, type casts) between stages.Report validation failures with the rule, stage, and violating value.Support breakpoints that pause replay at a chosen stage.Attach stage logs to the records they affected.Save/load debugging sessions for reproducibility.Never write to or alter the target data store — replay is read-only.User Stories
- As a data engineer, I want to trace a rejected record to the exact transform and value, so that I fix the root cause instead of the symptom.
- As an analytics engineer, I want to see the schema change between my SQL step and the load step, so that I catch silent type casts before they corrupt reports.
- As a student, I want to replay sample records through a demo pipeline, so that I understand what each ETL stage actually does.
MVP Scope
A single integration target: CSV → Python transforms → validation rules → SQLite/Postgres load, with the tool reading the pipeline definition from a simple YAML config.Capture pipeline (sample records, intermediates, schema snapshots, logs).Graph view with row counts and failures.Record replay with input/output per stage.Schema-change highlighting.Validation-failure details and rejected-record quarantine.Save/load debugging sessions.API sources, live-run capture for other frameworks, and a plugin system for arbitrary pipeline runners are natural second-phase additions.
Project Timeline
- Phase 1 — Research (Week 1): Define the capture format (record samples, intermediates, schema snapshots); map the MVP integration target’s execution model.
- Phase 2 — MVP (Weeks 3–5): Capture module, graph renderer, replay engine, and breakpoints.
- Phase 3 — Testing (Week 6): Golden-record tests, schema-diff tests, and replay correctness checks.
- Phase 4 — Deployment (Week 7): Package as a Python tool with a local web UI; document the integration contract.
- Phase 5 — Improvements (Ongoing): API-source support, other framework adapters, and a plugin API.
Testing Strategy
- Golden-record tests — captured sessions replay byte-identically to the original run.
- Schema-diff tests — known transformations produce the expected highlighted changes.
- Validation tests — planted rule failures appear with correct rule, stage, and value.
- Replay-fidelity tests — replaying never mutates the source data or target store.
- Manual smoke test — debug a deliberately broken pipeline end-to-end and verify the root cause surfaces.
Deployment Considerations
- Distribute as a pip package with a bundled local web UI (no external service).
- Keep captured sessions as plain files (JSON/Parquet) so they are portable and shareable.
- Document the integration contract clearly; explicitly state which pipeline runners are supported in the MVP.
- Add CI that runs the test suite against generated sample pipelines.
- Capture only samples (configurable) plus per-stage aggregates — not every row of a large pipeline.
- Render graphs lazily; a pipeline with hundreds of stages should still load.
- Stream large captured sessions from disk instead of loading them fully into memory.
- Index rejected records by stage and rule for fast filtering.
Success Metrics
- Time-to-root-cause — the core metric: how quickly a reported failure can be traced to a stage/rule/value (measured in internal usage, not claimed externally).
- Replay fidelity — captured sessions reproduce the original run exactly (automated tests).
- Adoption — installs and weekly active usage for an open-source tool.
- Coverage — every validation rule fires with evidence in tests.
Common Challenges
- Capture overhead — recording intermediates for every stage costs time and disk; sampling and configurable verbosity are required.
- Framework variety — ETL platforms differ wildly; universal compatibility is not realistic, so the MVP targets one well-defined integration and exposes a contract for adapters.
- Schema drift — real schemas change between runs; the tool must snapshot per stage rather than assume one schema.
- Large records — blob fields bloat captures; truncate and summarize heavy values with a pointer to the source.
- Scope creep — it is tempting to build a full pipeline runner; the tool observes pipelines, it does not execute them.
Learning Objectives
- Understand ETL architecture: extract, transform, load, validation, and schema evolution.
- Learn how to instrument code for observability (capture, sampling, correlated logs).
- Practice graph rendering and interactive debugging UI design.
- Practice building read-only tools that never mutate the systems they observe.
- Learn reproducibility patterns for debugging sessions.
Why This Idea Is Different
The site already covers pipeline monitoring: the smart data pipeline monitor alerts you when a pipeline run is slow or failing, and the data quality scorecard scores datasets against quality rules. This tool fills the third role in that web — debugging: given that a pipeline failed (monitor) or that data is bad (scorecard), where did it go wrong and why, record by record? The three tools are complementary and explicitly not substitutes for one another.
It is also deliberately honest about scope: it targets a defined integration (CSV → transforms → validation → warehouse) and documents the contract for future adapters, rather than claiming universal ETL compatibility.
| Tool type | Approach | Limitation |
|———–|———-|————|
| Pipeline orchestration UIs | Show run status, logs, DAGs | Little record-level detail; not built for debugging |
| Log aggregation tools | Centralize logs | Logs aren’t correlated to specific records |
| Data observability platforms | Monitor quality and freshness | Alert on problems; don’t trace a record through stages |
| Step debuggers (code-level) | Debug a single transform function | No pipeline-level view; lose the record context |
This project’s differentiator: record-level lineage replay with schema-change highlighting, validation-failure detail, and sample-based breakpoints — purpose-built for ETL debugging rather than adapted from monitoring.
Technology Stack
- Python 3.10+ — capture module and replay engine
- YAML — pipeline definition and session format
- FastAPI or Flask — local web UI serving the graph and replay views
- React or plain JS — graph rendering (SVG) in the browser
- Parquet/JSON — portable capture files
- pytest — replay-fidelity and schema-diff tests
Future Enhancements
- API and database sources beyond CSV
- Adapters for popular pipeline runners via the documented contract
- Diff view between pipeline runs — what changed in this run vs. the last
- Team sharing of debugging sessions with annotations
- Scheduled capture on a staging pipeline for pre-emptive debugging
- Queryable rejected-record store for long-term data-quality analysis
Browse more Data Science ideas · Product Ideas