Automated Data Quality Scorecard for Data Teams
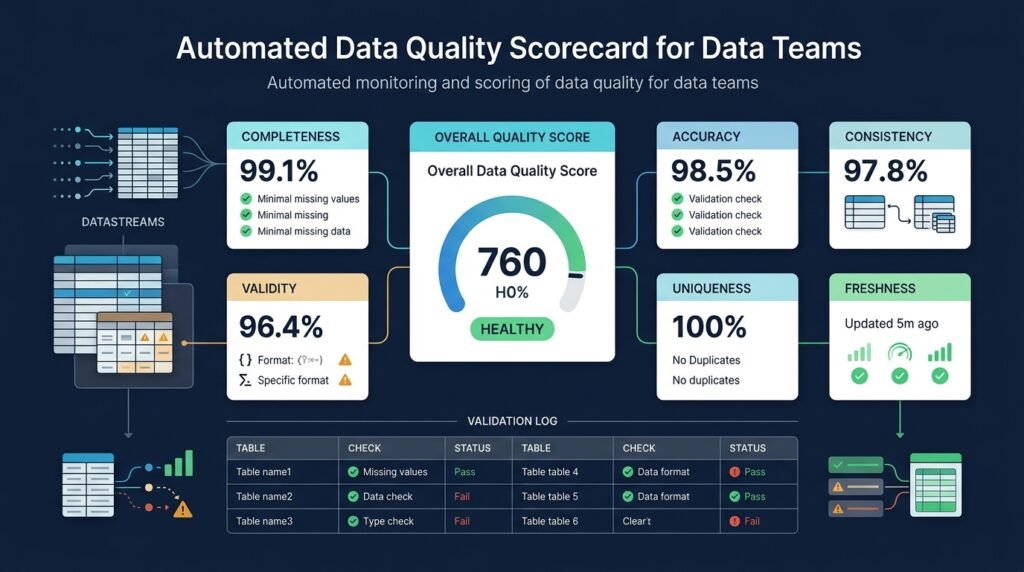
A Python tool that scores tables and datasets against configurable quality rules — completeness, uniqueness, validity, and timeliness — stores the results as trend history, and publishes a scorecard your team can actually use. Instead of hoping bad data gets caught before it reaches consumers, you get a repeatable, measurable picture of how trustworthy each dataset is.
Who Is This For?
- Data engineers responsible for pipelines and the datasets they produce
- Analytics engineers who maintain transformed models and want them trustworthy
- Data platform leads who need a standardized way to report data quality to stakeholders
- Data teams in startups that can’t justify an enterprise data-observability platform
- Students building data pipelines who want to learn quality-testing patterns
The Problem
Bad data doesn’t announce itself. A column silently fills with NULLs, a deduplication step starts producing duplicates, a source format change makes every date invalid — and the first person to notice is usually the analyst whose report is wrong, or the customer whose dashboard is broken.
Teams have two unsatisfactory options:
- Reactive checking — validation happens ad hoc when someone suspects a problem. By then the bad data has already reached downstream consumers.
- Enterprise observability suites — powerful, but expensive, heavyweight, and often overkill for a team with a dozen tables and a single Postgres warehouse.
The deeper issue is that “data quality” stays vague. Teams talk about it, but without defined metrics, agreed thresholds, and history, quality can’t be measured, compared, or improved. A scorecard turns an opinion into a number that everyone can look at.
How It Works
The tool applies declarative quality rules to tables, computes scores from the results, stores every run, and publishes a report.
Rule Configuration
Quality checks are defined in a declarative config file — SQL-based, so they run against whatever database you already use:
tables: orders: completeness: required_columns: [order_id, customer_id, total_amount] uniqueness: columns: [order_id] validity: - column: total_amount sql: "total_amount >= 0" - column: status allowed_values: [pending, paid, shipped, cancelled] timeliness: max_staleness_hours: 24
Score Computation
Each rule produces a pass/fail result; scores are aggregated per dimension and per dataset:
- Completeness — percentage of non-null values in required columns (
non-null / total) - Uniqueness — percentage of distinct values in columns that should be unique
- Validity — percentage of rows satisfying declared constraints or allowed values
- Timeliness — whether the data is fresh enough given its expected update cadence
A dataset score rolls the dimensions up into a single 0–100 number, so a stakeholder can ask “is the orders table healthy?” and get an answer — while an engineer can drill into exactly which rule failed.
Trend History and Alerts
Every scheduled run appends to a history table. The tool then:
- Plots score trends over time (is quality improving or decaying?)
- Alerts when a score drops below a configured threshold
- Flags regressions — a score that was 98 and is now 91
Scorecard Output
Results publish as:
- An HTML scorecard — a human-readable page per dataset with dimension scores and rule details
- A REST endpoint — JSON so other tools can consume the same numbers
┌──────────────┐ ┌──────────────────┐ ┌────────────────┐ │ Rule Config │──▶│ Check Runner │──▶│ Score │ │ (YAML) │ │ (scheduled / CI)│ │ Aggregator │ └──────────────┘ └────────┬─────────┘ └───────┬────────┘ │ │ ┌─────────▼─────────┐ ┌───────▼────────┐ │ Results Store │──▶│ Scorecard │ │ (trend history) │ │ HTML + REST │ └───────────────────┘ └────────────────┘
Core Workflow
db-quality check → run all configured rules, print a report db-quality run → check + store results + history + optional alerts db-quality report → regenerate the HTML scorecard from stored results db-quality history --table orders → trend view for one dataset
Configure — declare rules for each table you care about.Run — execute on a schedule (cron) or as a CI step.Store — every run’s scores become history.Alert — thresholds and regressions trigger notifications.Publish — the scorecard is regenerated for the team.Key Features
- Declarative rule DSL — SQL-based checks in a YAML config, no custom code per check
- Four quality dimensions — completeness, uniqueness, validity, timeliness
- Score aggregation — dimension scores and a single roll-up per dataset
- Trend history — scores over time, so quality is measurable, not anecdotal
- Threshold alerts — notify when quality drops below agreed levels
- Scorecard output — HTML report and REST endpoint
- CLI + CI integration — run as a cron job or a step in your pipeline
Functional Requirements
Load a rule configuration from a YAML file.Connect to a Postgres (first version) database and execute rule queries.Compute per-dimension and aggregate scores for each configured table.Persist each run’s results with a timestamp for trend history.Compare against configured thresholds and emit alerts (log / webhook).Generate an HTML scorecard and a JSON REST response.Support a --fail-below flag so CI can block on quality regressions.Non-Functional Requirements
- Scheduling — runs are batch jobs; a run against a modest warehouse completes within minutes, not hours.
- Observability of the checker itself — rule execution failures are reported, not silently skipped.
- Portability — config is plain files in the repo, so checks are version-controlled and reviewable.
- Simplicity — a single Python package with a CLI; no service, no UI framework required for v1.
User Stories
- As a data engineer, I want a scheduled check to alert me when the
orders table drops below its completeness threshold, so that I can fix the source before analysts notice. - As an analytics engineer, I want a single score per dataset, so that I can tell stakeholders whether a model is trustworthy without explaining every rule.
- As a platform lead, I want trend history, so that I can show quality improving over time or catch slow decay early.
MVP Scope
SQL-based rules for completeness, uniqueness, and validity on Postgres.Score aggregation with configurable dimension weights.Results stored in a small results table (SQLite for v1).HTML scorecard generation.CLI with check, run, and report subcommands.Threshold alerts to a webhook.Timeliness checks, the REST endpoint, and CI block-on-fail integration are second-phase additions.
Project Timeline
- Phase 1 — Research (Week 1): Study existing approaches (great-expectations-style validations, dbt tests, enterprise observability) and define the four dimensions operationally.
- Phase 2 — MVP (Weeks 2–4): Rule DSL, Postgres runner, score aggregation, SQLite results store, HTML report.
- Phase 3 — Testing (Week 5): Rule-fixture tests, score-computation unit tests, end-to-end test against a seeded Postgres.
- Phase 4 — Deployment (Week 6): Package with
pip, document cron/CI usage, add a sample config for a demo warehouse. - Phase 5 — Improvements (Ongoing): Timeliness checks, REST endpoint, alert integrations, more databases.
Testing Strategy
- Rule fixtures — small known datasets with hand-computed expected scores; assert exact matches.
- Aggregation tests — verify dimension weighting and roll-up math.
- Integration tests — run the full
check/run/report flow against a disposable Postgres instance. - Failure-path tests — a rule with invalid SQL fails loudly and does not poison the run’s other results.
- Regression tests — a fixed warehouse snapshot produces identical scores across versions.
Deployment Considerations
- Distribute as a
pip-installable CLI with minimal dependencies (SQLAlchemy, PyYAML, Jinja2). - Run as a cron job or a scheduled GitHub Actions workflow; results are written to a results store.
- The scorecard can be served from a static directory or via the REST endpoint for dashboards.
- Version the rule config with your code — quality rules are code, and code review applies.
Security Considerations
- Data stays where it is — the checker queries the warehouse; it does not copy data anywhere.
- Database credentials come from environment variables, never from the config file.
- The REST endpoint, if exposed, returns scores only — never row data.
- Scope the checking account to read-only access.
Cost Considerations
- A single small VM or even a scheduled GitHub Actions job is enough for v1 — no platform fees, no per-GB pricing.
- The results store is tiny (one row per dataset per run), so storage costs are negligible.
Success Metrics
- Time to first report — from clone to a published scorecard for one dataset.
- Detection latency — how quickly a quality regression is noticed (vs. waiting for a user to complain).
- Coverage — percentage of critical tables covered by at least one rule.
- Score trend — measured improvement in dimension scores over time.
Common Challenges
- Rule drift — as schemas change, rules must be updated; failing loudly on missing columns beats silently skipping.
- Threshold fatigue — too many noisy alerts train people to ignore them; defaults should be conservative.
- Defining “valid” — validity rules need real domain knowledge (what statuses are legal, what ranges make sense); start with the obvious constraints.
- False confidence — a high score means the declared rules pass, not that the data is perfect; the report must say exactly what was checked.
Why This Idea Is Different
There are validation libraries and enterprise observability platforms, but this idea targets a specific gap: an opinionated, lightweight scorecard with history for teams that want measurable data quality without a platform project. The four dimensions are deliberately simple and operationally defined — scores are estimates of rule compliance, not claims that the data is “clean.”
This also sits clearly apart from the Smart Data Pipeline Monitor and Alert System: that tool alerts on pipeline runs — failures, durations, and operational health. This tool measures the quality of the data itself — completeness, uniqueness, validity, and timeliness — and tracks it over time. One watches the machinery; the other measures the product.
| Tool | Approach | Limitation |
|——|———-|————|
| Great Expectations | Rich assertion library | Powerful but heavy; no built-in team scorecard focus |
| dbt tests | In-transformation tests | Tied to dbt; point-in-time, no score aggregation or history |
| Enterprise observability (Monte Carlo, etc.) | Full platform | Expensive, heavyweight, overkill for small teams |
| Custom validation scripts | Team-written checks | No standardization, no history, no scorecard |
This idea is the middle path: a single Python package that defines quality as four measurable dimensions, stores history, and publishes a scorecard — without becoming a platform.
Technology Stack
- Python 3.10+ — tool runtime; the language data teams already use
- SQLAlchemy — database connectivity for Postgres (v1) and future engines
- PyYAML — rule configuration parsing
- Jinja2 — HTML scorecard templates
- SQLite — lightweight results/history store for v1
- pytest — testing
Future Enhancements
- Timeliness dimension — expected update cadence vs. observed freshness
- REST scorecard API — JSON endpoints for dashboards and other tools
- Alert integrations — Slack, email, PagerDuty
- More databases — Snowflake, BigQuery, Redshift
- Rule templates — reusable checks for common cases (IDs non-null, dates in range, referential integrity)
- CI block-on-fail — fail a pipeline when scores regress
Browse more Data Science ideas · Product Ideas