Cloud Infrastructure Cost Anomaly Detector and Alert System
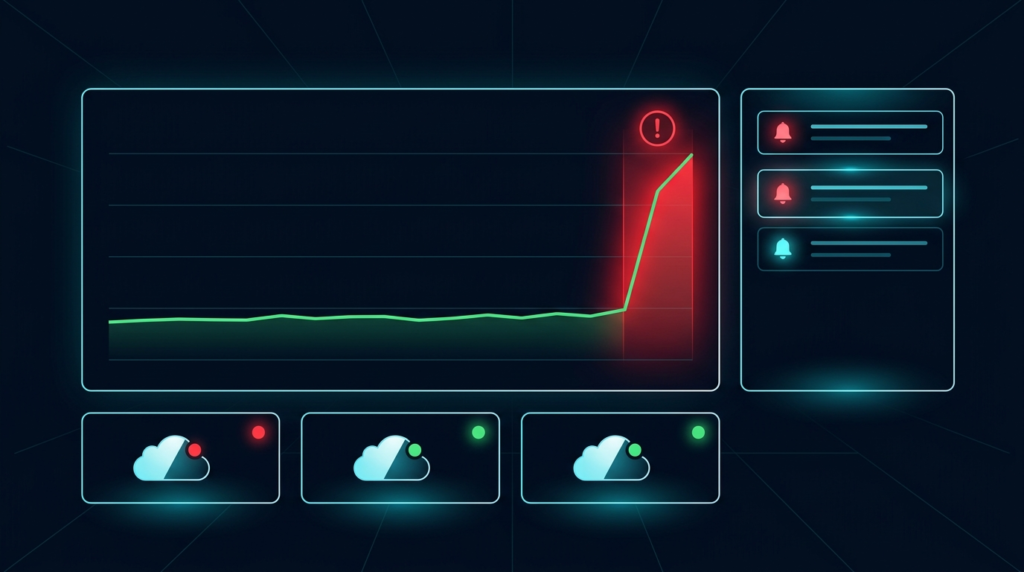
A product concept for a tool that monitors cloud spending in real-time, detects abnormal cost patterns using statistical anomaly detection, and alerts engineering and finance teams before budget overruns occur.
Who Is This For?
- Cloud engineers responsible for managing AWS, GCP, or Azure infrastructure
- FinOps teams tracking cloud spending against budgets
- Startup CTOs who need visibility into cloud costs without dedicated financial infrastructure
- SREs who manage cloud resources and need to detect misconfigurations that cause cost spikes
- Engineering managers who want to understand team-level cloud spending patterns
The Problem
Cloud bills can spike unexpectedly for reasons that are difficult to predict:
- Auto-scaling misconfiguration — An auto-scaler without proper upper bounds can launch hundreds of instances during traffic spikes
- Forgotten test resources — Development teams spin up test environments and forget to shut them down
- Traffic anomalies — DDoS attacks, viral content, or data scraping can cause sudden traffic increases that drive up costs
- Storage growth — Log files, backups, and data accumulation can cause gradual cost increases that become significant over months
- Reserved instance gaps — Expired reserved instances revert to on-demand pricing, sometimes doubling costs
The consequences are real:
- A misconfigured auto-scaler running for 8 hours on AWS can cost thousands of dollars
- Forgotten EC2 instances running for a month can cost hundreds of dollars with zero business value
- Unexpected storage growth can cause budget overruns that weren’t forecast
Existing cost management tools (AWS Cost Explorer, GCP Billing, Azure Cost Management) show historical spending trends and provide basic forecasting. They don’t proactively detect anomalies or alert teams when spending deviates from expected patterns. By the time someone notices a cost spike in the monthly report, the damage is done.
How It Works
Data Collection
The tool ingests cost data from cloud providers:
| Data Source | Data Points | Frequency |
|————|————-|———–|
| AWS Cost and Usage Report | Service, region, instance type, usage hours, cost | Hourly |
| GCP Billing Export | Service, project, SKU, usage, cost | Hourly |
| Azure Cost Management | Service, resource group, resource, cost | Hourly |
| Custom tags | Team, environment, project | With each data point |
Baseline Establishment
Before detecting anomalies, the tool establishes expected spending patterns:
Daily patterns — Some workloads have daily cycles (higher during business hours, lower at night). The baseline captures these patterns.
Weekly patterns — Some workloads have weekly cycles (higher on weekdays, lower on weekends). The baseline captures these patterns.
Seasonal patterns — Some workloads have monthly or quarterly patterns (end-of-month batch processing, quarterly reporting). The baseline captures these patterns.
Growth trends — Legitimate cost growth (more users, more data) should be distinguished from anomalies. The baseline includes a trend component.
Anomaly Detection Methods
The tool uses multiple detection methods:
1. Threshold-Based Detection
Simple, rule-based detection:
- Alert when daily cost exceeds X% above the 7-day moving average
- Alert when hourly cost exceeds a fixed dollar threshold
- Alert when any single resource exceeds a cost limit
IF daily_cost > (7_day_moving_avg × 1.5) THEN alert IF hourly_cost > $100 THEN alert IF resource_daily_cost > $50 THEN alert
2. Statistical Anomaly Detection
More sophisticated detection using statistical methods:
- Z-score — How many standard deviations is the current cost from the mean? A Z-score > 3 typically indicates an anomaly.
- Moving average deviation — How does the current cost compare to the moving average? A deviation > 30% may indicate an anomaly.
- Seasonal decomposition — Separate the cost signal into trend, seasonal, and residual components. Anomalies appear in the residual.
3. Service-Level Analysis
When an anomaly is detected, the tool drills down to identify which service, region, or resource is responsible:
Overall anomaly detected: +42% above expected daily costRoot cause analysis: EC2 us-east-1: +$340 (+67% of anomaly) Instance i-0abc123: $180 (new, not in baseline) Instance i-0def456: $120 (terminated yesterday, still billing?) Instance group "test-cluster": $40 (running since 3 days ago) S3 us-east-1: +$80 (+19% of anomaly) Bucket "logs-backup": +$80 (growth rate: 2GB/day) RDS us-west-2: +$45 (+11% of anomaly) Instance db-large: $45 (upsized from db-medium 2 days ago)
Alert System
| Alert Type | Trigger | Channel |
|————|———|———|
| Cost spike | Daily cost > 150% of moving average | Slack, email |
| Resource anomaly | Single resource cost > baseline | Slack, email |
| Budget threshold | Monthly spend > 80% of budget | Slack, email |
| Budget exceeded | Monthly spend > 100% of budget | Slack, email, PagerDuty |
| New resource | Resource created not in baseline | Slack |
| Idle resource | Resource running with zero utilization > 24h | Slack, email |
Core Workflow
Cloud Provider → Cost Data Ingestion → Baseline Establishment → Anomaly Detection → Alert + Dashboard
Connect — Authenticate with cloud provider billing APIsIngest — Collect hourly cost data with service, resource, and tag breakdownBaseline — Establish expected spending patterns over 30-day learning periodDetect — Run anomaly detection algorithms on incoming dataAlert — Notify teams when anomalies are detectedInvestigate — Provide drill-down analysis to identify root causeRecommend — Suggest specific actions (terminate instance, resize, set budget)Key Features
- Multi-cloud support — Works with AWS, GCP, and Azure billing APIs
- Real-time monitoring — Hourly cost data ingestion and analysis
- Statistical anomaly detection — Z-score, moving average deviation, and seasonal decomposition
- Service-level drill-down — Identify which service, region, or resource caused the anomaly
- Budget management — Set budgets by team, project, or service with threshold alerts
- Idle resource detection — Find resources running with zero utilization
- Cost forecasting — Predict end-of-month spend based on current trends
- Team-level attribution — Track costs by team using resource tags
- Historical comparison — Compare current spend against previous months
- Slack/email/PagerDuty alerts — Multiple notification channels
- Dashboard — Real-time cost overview with anomaly timeline
Technical Architecture
┌─────────────────────────────────────────────┐ │ Cloud Provider Billing APIs │ │ (AWS Cost Explorer, GCP Billing, Azure) │ └──────────────────┬──────────────────────────┘ │ (API polling + webhooks) ┌─────────▼─────────┐ │ Cost Ingestion │ │ (Celery workers) │ └─────────┬─────────┘ │ ┌─────────▼─────────┐ │ Time-Series DB │ │ (PostgreSQL + │ │ TimescaleDB) │ └─────────┬─────────┘ │ ┌─────────▼─────────┐ │ Analysis Engine │ │ (Anomaly detection│ │ + baseline) │ └─────────┬─────────┘ │ ┌──────────────┼──────────────┐ │ │ │ ┌───▼───┐ ┌────▼────┐ ┌────▼────┐ │Dashboard│ │ Alert │ │ API │ │ (React)│ │ Service │ │ Server │ └───────┘ └─────────┘ └─────────┘
Technology Choices
| Component | Technology | Why |
|———–|———–|—–|
| Backend | Python + FastAPI | Analysis ecosystem, async support |
| Data ingestion | Celery + Redis | Background polling and processing |
| Database | PostgreSQL + TimescaleDB | Time-series optimized, SQL-compatible |
| Analysis | NumPy + SciPy | Statistical anomaly detection |
| Frontend | React + Recharts | Dashboard visualization |
| Cloud clients | boto3, google-cloud-billing, azure-mgmt-costmanagement | Official SDKs |
| Alerts | Celery Beat + Slack API | Scheduled detection, notification delivery |
| Deployment | Docker Compose | Self-hosted deployment |
MVP Scope
AWS Cost Explorer integration (hourly data ingestion)Daily cost anomaly detection using Z-score methodService-level drill-down when anomaly detectedSlack alert notification for anomaliesDashboard showing daily cost trend with anomaly markersBasic budget threshold alerts30-day historical cost viewImplementation Approach
Phase 1: Data Pipeline (Weeks 1-3)
Build the AWS Cost Explorer integration. Implement hourly data ingestion and storage in TimescaleDB. Build the baseline establishment algorithm with daily and weekly pattern detection.
Phase 2: Anomaly Detection (Weeks 4-6)
Implement Z-score and moving average deviation detection. Build the service-level drill-down analysis. Add seasonal decomposition for longer-term patterns.
Phase 3: Dashboard (Weeks 7-9)
Build the React dashboard with cost trend charts, anomaly markers, and drill-down panels. Add budget management and team attribution views.
Phase 4: Alerts and Multi-Cloud (Weeks 10-12)
Implement Slack and email alerts. Add GCP and Azure support. Build the cost forecasting model. Add idle resource detection.
Challenges and Tradeoffs
- Legitimate vs. anomalous growth — A growing startup’s costs should increase over time. The tool must distinguish between legitimate growth and genuine anomalies. The seasonal decomposition and trend components help, but edge cases exist.
- Cost data latency — Cloud provider billing data is typically 1-24 hours delayed. The tool can’t detect anomalies in real-time — it detects them as soon as data is available.
- Multi-service complexity — A cost spike might be distributed across multiple services. The tool must aggregate and correlate across services to identify the root cause.
- Tag quality — Cost attribution by team depends on resource tagging. Poor tagging leads to unattributed costs.
Why This Idea Is Different
Existing cost management tools focus on showing what you spent. This Idea focuses on detecting when something is wrong. The key differentiator: proactive anomaly detection with automatic root-cause analysis.
AWS Cost Anomaly Detection exists but is limited to AWS and uses a simple threshold approach. This Idea provides multi-cloud support, statistical anomaly detection methods, and service-level drill-down that existing tools don’t offer.
The FinOps focus is also different — this tool is designed for the growing FinOps discipline, not just for engineers who want to see a cost chart.
| Tool | Approach | Limitation |
|——|———-|————|
| AWS Cost Anomaly Detection | AWS-native anomaly detection | AWS only, limited analysis |
| GCP Budget Alerts | Threshold-based budget alerts | No anomaly detection, no analysis |
| Azure Cost Management | Cost analysis and recommendations | No real-time anomaly detection |
| Spot.io | Cloud cost optimization | Focused on spot instances, not anomaly detection |
| Kubecost | Kubernetes cost monitoring | K8s only, not general cloud costs |
This Idea provides multi-cloud anomaly detection with statistical analysis and drill-down capabilities that no existing single tool offers.
Technology Stack
- Python 3.11+ — Backend and analysis engine
- FastAPI — REST API server
- PostgreSQL + TimescaleDB — Time-series cost data storage
- NumPy + SciPy — Statistical anomaly detection
- Celery + Redis — Background job processing
- React 18 — Dashboard frontend
- Recharts — Data visualization
- boto3 — AWS Cost Explorer API
- google-cloud-billing — GCP Billing API
- azure-mgmt-costmanagement — Azure Cost Management API
- Docker Compose — Self-hosted deployment
Future Extensions
- Predictive cost forecasting — ML-based cost prediction using historical patterns
- Anomaly explainability — AI-generated explanations of why an anomaly occurred
- Auto-remediation — Automatically stop idle resources or downscale over-provisioned instances
- Multi-account support — Aggregate costs across multiple cloud accounts
- Cost allocation — Showback/chargeback reports for internal teams
- Integration with IaC — Correlate cost changes with Terraform/CloudFormation deployments
- Anomaly simulation — Simulate cost scenarios for capacity planning
Browse more DevOps ideas · Product Ideas