Project Idea · Advanced · Python, Cloud, Docker/Kubernetes
Problem Statement
Most infrastructure monitoring tools use simple thresholds, producing alert fatigue from false positives and missing gradual issues. Teams need monitoring that understands context and patterns.
Proposed Solution
Build an infrastructure monitoring system that applies anomaly detection to identify unusual patterns before they become incidents. It learns what normal looks like for each metric and correlates across services for root cause analysis.
Key Features
- Multi-source metrics — CPU, memory, disk, network, HTTP, database
- Anomaly detection — Statistical and ML-based
- Predictive alerts — Warn before thresholds breach
- Root cause correlation — Cross-service analysis
- Alert routing — Slack, email, PagerDuty
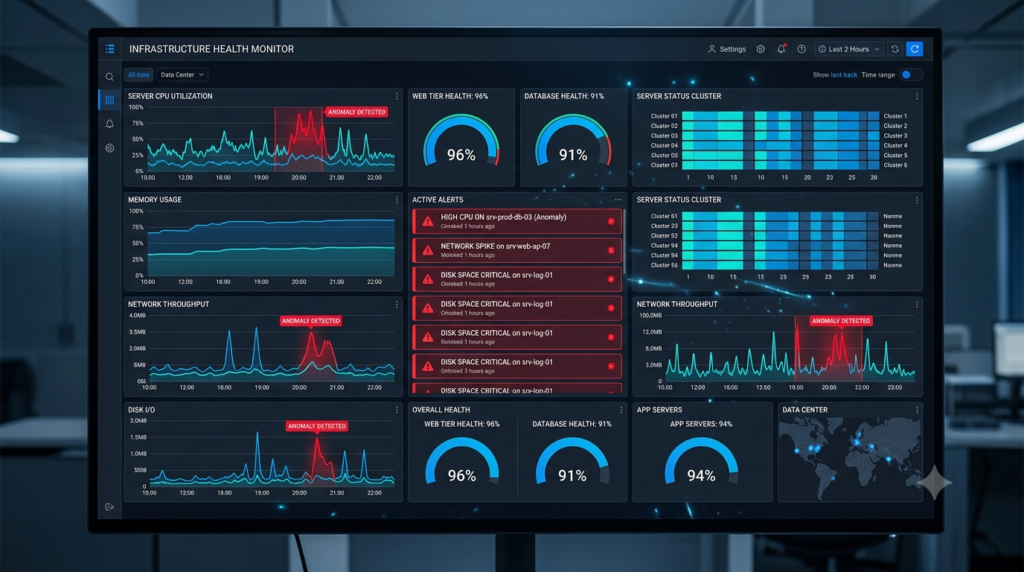
- Dashboard — Real-time with anomaly highlights
- Docker/Kubernetes — Native container metrics
Technology Stack
- Python 3.11+ — Agents, API, anomaly detection
- FastAPI — REST API
- TimescaleDB — Time-series storage
- scikit-learn — Anomaly detection
- React — Dashboard
FAQ
What makes this different from Prometheus/Grafana?
Prometheus collects metrics, Grafana visualizes them. Neither provides intelligent anomaly detection or predictive alerting out of the box.