Automated CI/CD Pipeline Performance Analyzer
A product concept for a tool that connects to CI/CD platforms, analyzes pipeline execution data, identifies performance bottlenecks, and provides actionable recommendations to reduce build, test, and deployment times.
Who Is This For?
- DevOps engineers responsible for maintaining and optimizing CI/CD pipelines
- SREs (Site Reliability Engineers) monitoring build infrastructure and deployment velocity
- Engineering managers tracking team productivity and build costs
- Platform teams managing shared CI/CD infrastructure across multiple teams
- Startup CTOs who want faster deployments without hiring a dedicated DevOps team
The Problem
CI/CD pipelines are the backbone of modern software delivery, but their performance degrades slowly and invisibly. Build times creep up over months as more tests are added, dependencies grow, and pipeline configurations become more complex. Teams often don’t notice the problem until builds that used to take 10 minutes now take 45 minutes.
The consequences are real:
- Developer productivity — Every minute of build time is a minute a developer waits. For a team of 20 developers running 10 builds per day, a 30-minute build wastes 100 hours of engineer time per day.
- Deployment velocity — Slow pipelines delay releases. Teams may skip deployments to avoid waiting, reducing deployment frequency.
- Infrastructure costs — Slow builds consume more compute minutes. On GitHub Actions, this means more billable minutes. On self-hosted runners, this means more hardware utilization.
- Flaky test detection — Intermittent test failures cause retries, further extending pipeline times. Without analysis, teams don’t know which tests are flaky.
The core challenge: CI/CD platforms provide raw build logs and basic timing, but not the analytical depth needed to identify which specific stages, jobs, or steps are bottlenecks and what optimizations would have the most impact.
How It Works
The tool connects to your CI/CD platform, ingests pipeline execution data, and provides multi-level analysis:
Data Collection
The tool collects data from pipeline runs:
| Data Point | Source | Purpose |
|————|——–|———|
| Stage duration | Platform API | Identify slow stages |
| Job duration | Platform API | Identify slow jobs within stages |
| Step duration | Build logs | Identify slow steps within jobs |
| Queue time | Platform API | Identify runner availability issues |
| Resource usage | Runner metrics | Identify CPU/memory bottlenecks |
| Test results | Test reports | Identify slow and flaky tests |
| Artifact size | Platform API | Identify large artifact generation |
| Dependency install time | Build logs | Identify slow dependency resolution |
| History | Platform API | Trend analysis over time |
Analysis Engine
The tool performs several types of analysis:
1. Stage-Level Analysis
Breaks down each pipeline into stages and measures the time spent in each. Identifies which stage is the bottleneck and whether stages could be parallelized.
Example output:
Pipeline: deploy-production (run #1247) Total duration: 42m 18sStage Breakdown: install-deps: 8m 42s ██████████████████ (20.6%) lint: 2m 15s ████ (5.3%) unit-tests: 12m 33s ████████████████████████████ (29.7%) ← BOTTLENECK integration: 9m 45s ████████████████████ (23.1%) build: 5m 12s ██████████ (12.3%) deploy: 3m 51s ███████ (9.0%)
2. Trend Analysis
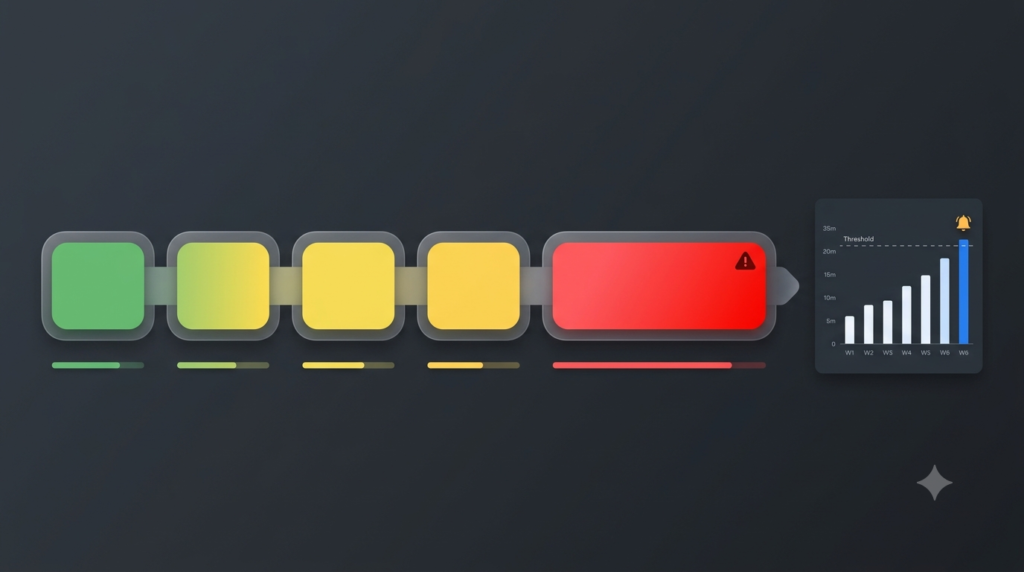
Tracks pipeline duration over time and identifies gradual performance degradation. Alerts when average build time exceeds a configurable threshold.
3. Job Comparison
Compares identical jobs across runs to identify inconsistency. Flags jobs with high duration variance as potential flaky tests.
4. Resource Utilization
When available, analyzes CPU and memory usage during each job. Identifies jobs that are CPU-bound (need faster runners) vs. I/O-bound (need faster disks or network).
5. Optimization Recommendations
Based on the analysis, generates specific recommendations:
| Finding | Recommendation |
|———|—————-|
| Dependency install takes 8+ minutes | Cache dependencies; use lockfile-only install |
| Unit tests take 12+ minutes | Parallelize test suites; identify slow test files |
| Single job runs sequentially | Split into parallel jobs |
| Build artifact is 2GB | Optimize artifact inclusion; compress output |
| Flaky test retries 3 times | Quarantine flaky test; fix or remove |
| Queue time > 5 minutes | Add more runners; use larger runner pool |
CI/CD Platform Integrations
| Platform | Integration Method | Data Available |
|———-|——————-|—————-|
| GitHub Actions | REST API + webhooks | Workflow runs, jobs, steps, timing, artifacts |
| GitLab CI | REST API + webhooks | Pipelines, jobs, stages, timing, artifacts |
| Jenkins | REST API + Blue Ocean | Builds, stages, steps, timing, test results |
| CircleCI | REST API | Pipelines, workflows, jobs, timing |
| Azure DevOps | REST API | Pipelines, stages, jobs, timing |
Core Workflow
CI/CD Platform → Webhook/API → Data Ingestion → Analysis Engine → Dashboard + Alerts
Connect — Authenticate with your CI/CD platform via OAuth or API tokenIngest — Collect historical pipeline data and subscribe to webhook events for real-time updatesAnalyze — Run analysis algorithms on collected data to identify patterns, bottlenecks, and anomaliesVisualize — Display results in dashboards with drill-down capabilityRecommend — Generate specific, actionable optimization recommendationsAlert — Notify when pipeline performance degrades beyond thresholdsKey Features
- Multi-platform support — Works with GitHub Actions, GitLab CI, Jenkins, and CircleCI
- Automatic bottleneck detection — Identifies the slowest stage, job, or step in every pipeline run
- Trend tracking — Monitors pipeline duration over weeks and months to catch gradual degradation
- Flaky test detection — Identifies tests that intermittently fail and cause pipeline retries
- Parallelization analysis — Suggests which sequential jobs could run in parallel
- Cost estimation — Calculates compute cost per pipeline run based on platform pricing
- Optimization recommendations — Provides specific, actionable suggestions for each bottleneck
- Team comparison — Compares pipeline performance across teams using shared infrastructure
- Historical comparison — Compare current pipeline performance against historical baselines
- Webhook-based alerts — Notify Slack, email, or webhook when performance degrades
Technical Architecture
┌─────────────────────────────────────────────┐ │ CI/CD Platform (GitHub, etc.) │ └──────────────────┬──────────────────────────┘ │ (Webhooks + REST API) ┌─────────▼─────────┐ │ Data Ingestion │ │ (Event Stream) │ └─────────┬─────────┘ │ ┌─────────▼─────────┐ │ Time-Series DB │ │ (PostgreSQL + │ │ TimescaleDB) │ └─────────┬─────────┘ │ ┌─────────▼─────────┐ │ Analysis Engine │ │ (Python workers) │ └─────────┬─────────┘ │ ┌──────────────┼──────────────┐ │ │ │ ┌───▼───┐ ┌────▼────┐ ┌────▼────┐ │Dashboard│ │ Alert │ │ API │ │ (React)│ │ Service │ │ Server │ └───────┘ └─────────┘ └─────────┘
Technology Choices
| Component | Technology | Why |
|———–|———–|—–|
| Backend | Python + FastAPI | ML/analysis ecosystem, async support |
| Data ingestion | Celery + Redis | Background job processing |
| Database | PostgreSQL + TimescaleDB | Time-series optimized, SQL-compatible |
| Frontend | React + Recharts | Dashboard visualization |
| CI/CD clients | REST API wrappers | Platform-specific data collection |
| Alerts | Celery Beat + Slack API | Scheduled checks, notification delivery |
| Deployment | Docker Compose | Self-hosted deployment option |
| Auth | OAuth 2.0 | Platform authentication |
MVP Scope
GitHub Actions integration (OAuth connection, data ingestion)Pipeline duration analysis with stage-level breakdownTrend chart showing pipeline duration over timeBottleneck identification for the slowest stage/jobBasic optimization recommendationsSlack alert when pipeline exceeds duration thresholdDashboard with pipeline run historyImplementation Approach
Phase 1: Data Layer (Weeks 1-3)
Build the data ingestion pipeline for GitHub Actions. Connect via OAuth, fetch historical runs, parse stage/job/step timing. Store in TimescaleDB with appropriate schema for time-series analysis.
Phase 2: Analysis Engine (Weeks 4-6)
Implement bottleneck detection algorithms. Build trend analysis with moving averages. Implement flaky test detection using failure rate variance. Create the recommendation engine with rule-based suggestions.
Phase 3: Dashboard (Weeks 7-9)
Build the React dashboard with pipeline overview, drill-down to individual runs, trend charts, and recommendation cards. Add team comparison views.
Phase 4: Alerts and Multi-Platform (Weeks 10-12)
Implement Slack/email alerts for performance degradation. Add GitLab CI integration. Build the API for programmatic access. Add cost estimation based on platform pricing.
Challenges and Tradeoffs
- Data access granularity — Some CI/CD platforms don’t expose step-level timing through their API. The tool must work with whatever data is available and degrade gracefully.
- Pipeline diversity — Different teams structure pipelines differently. The analysis must be flexible enough to handle varied pipeline architectures.
- False positive recommendations — A recommendation to parallelize might not be possible if steps have dependencies. The tool must understand pipeline dependencies before recommending parallelization.
- Cost vs. value — Self-hosted teams may not care about compute costs. Cloud-based teams may care deeply. The cost estimation feature must be optional and configurable.
Why This Idea Is Different
Existing CI/CD platforms provide basic timing information (how long each job took) but not analytical depth. Tools like BuildKite and Armory offer some analytics, but they’re locked to their platforms. GitHub’s built-in Actions analytics are limited to usage metrics, not performance analysis.
This Idea is platform-agnostic, provides deep analytical insight (not just raw timing), and generates specific optimization recommendations. The key differentiator: it tells you not just what is slow, but why and how to fix it.
| Tool | Approach | Limitation |
|——|———-|————|
| GitHub Actions analytics | Usage metrics only | No performance analysis, no recommendations |
| Buildkite analytics | Pipeline analytics | Locked to Buildkite platform |
| Geckoboard / Datadog | General CI/CD dashboards | Require manual configuration, no auto-analysis |
| Sleuth | Deployment tracking | Focuses on deploy frequency, not pipeline performance |
This Idea combines platform-agnostic integration with automated analysis and recommendations.
Technology Stack
- Python 3.11+ — Backend and analysis engine
- FastAPI — REST API server
- PostgreSQL + TimescaleDB — Time-series pipeline data storage
- Celery + Redis — Background job processing
- React 18 — Dashboard frontend
- Recharts — Data visualization
- GitHub API / GitLab API — CI/CD platform integration
- Docker Compose — Self-hosted deployment
- pytest — Testing
Future Extensions
- Jenkins and CircleCI support — Expand platform coverage
- Cost optimization — Recommend runner types, spot instances, or caching strategies
- Test splitting — Automatically split slow test suites across parallel runners
- Pipeline configuration as code — Analyze pipeline YAML and suggest structural improvements
- Cross-repository analysis — Compare pipeline performance across repositories
- Integration with cloud cost tools — Feed pipeline cost data into tools like Kubecost or Infracost
- Auto-remediation — Automatically apply safe optimizations (e.g., enable dependency caching)
Browse more DevOps ideas · Product Ideas