Real-Time Dashboard Builder for IoT Data Streams
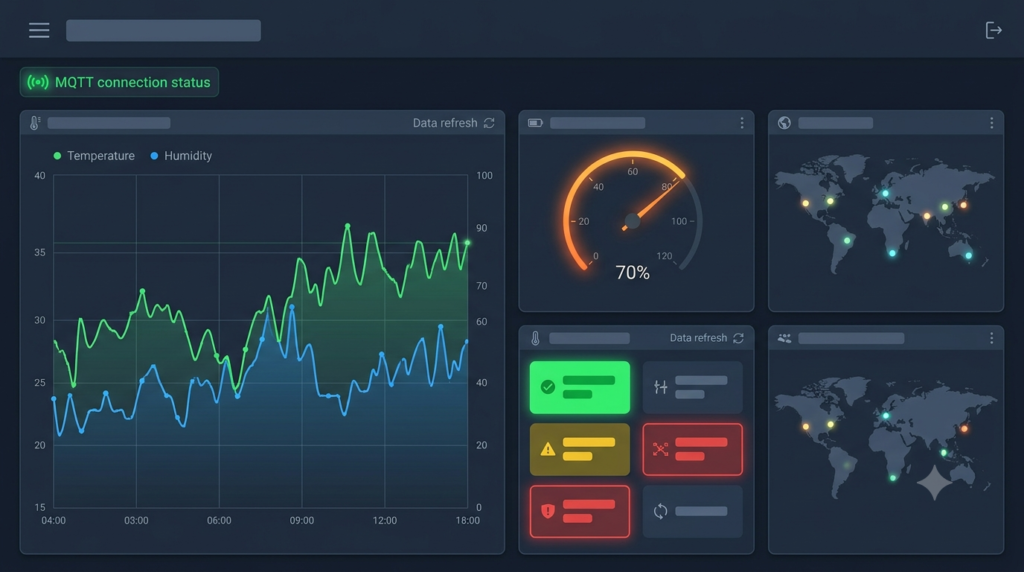
A project that connects to IoT devices and sensor streams, then automatically generates live dashboards showing real-time data — making it simple for developers and hobbyists to visualize sensor readings without building custom frontend code from scratch.
Who Is This For?
- IoT hobbyists running ESP32, Arduino, or Raspberry Pi projects who want to see sensor data without writing frontend code
- Maker community members building smart home, greenhouse, or weather monitoring projects
- Small-scale IoT developers prototyping sensor networks for agriculture, industrial monitoring, or environmental tracking
- Students learning IoT who want quick visual feedback on their sensor projects
The Problem
Building an IoT device is only half the challenge. The other half is visualizing the data it produces. Most IoT platforms (ThingSpeak, Blynk, Adafruit IO) offer pre-built widgets but limit customization. Open-source alternatives like Grafana require significant configuration for simple use cases. At the other end, building a custom dashboard from scratch means learning WebSocket connections, real-time charting libraries, and responsive layout — a lot of work just to see temperature readings.
The gap: IoT developers need a fast way to connect sensors to a live dashboard that they can customize without spending days on frontend development. Existing tools are either too locked down (commercial platforms) or too complex (Grafana + InfluxDB + Telegraf stack).
How It Works
The tool works in three steps:
Connect — Register your IoT devices via MQTT, HTTP POST, or WebSocket. The dashboard builder automatically discovers available data streams from each device.Configure — Use a drag-and-drop layout builder to place widgets (line charts, gauges, value displays, maps, alerts) on a dashboard. Each widget binds to a specific data stream.Visualize — The dashboard updates in real time as new sensor data arrives. Historical data is stored and available for trend analysis.Supported Data Sources
| Source | Protocol | Use Case |
|——–|———-|———-|
| MQTT broker | MQTT 3.1.1 / 5.0 | Most IoT sensors (ESP32, Arduino, Pi) |
| HTTP endpoint | REST POST | Simple sensor integrations |
| WebSocket | WS / WSS | High-frequency sensor streams |
| CSV file | Import | Historical data visualization |
| Serial port | USB / UART | Direct device connection |
Widget Types
| Widget | Description | Best For |
|——–|————-|———-|
| Line chart | Time-series with multiple series | Temperature, humidity, pressure |
| Gauge | Single value with min/max | Battery level, CPU usage |
| Value display | Large numeric readout | Current temperature, count |
| Status indicator | Color-coded OK/warning/alert | Device health, threshold alerts |
| Map | Geographic plot | GPS-tracked devices |
| Table | Sorted data rows | Device inventory, logs |
| Histogram | Distribution view | Frequency analysis |
Core Workflow
IoT Device → Data Ingestion → Time-Series Storage → Real-Time Engine → Dashboard Rendering
Device registration — Register devices with metadata (name, location, data types)Data ingestion — Accept data from MQTT, HTTP, or WebSocket sourcesTime-series storage — Store readings with timestamps in a lightweight databaseReal-time engine — Push updates to connected dashboard clients via Server-Sent EventsDashboard rendering — Render widgets with live data, responsive layout, and historical contextKey Features
- Automatic schema discovery — When a device publishes data, the builder infers the data schema (numeric, boolean, string) and suggests appropriate widgets
- Drag-and-drop layout — Build dashboards visually without writing HTML or JavaScript
- Real-time updates — Sub-second data propagation from sensor to dashboard
- Historical playback — Replay historical data through the same dashboard widgets
- Alert rules — Set thresholds on any data stream and receive notifications (email, webhook, push)
- Multi-device grouping — Organize devices into groups (e.g., “Greenhouse Sensors”, “Home Devices”)
- Embeddable — Generate an embed code to include a dashboard in any webpage
- Responsive design — Dashboards work on desktop, tablet, and mobile
Technical Architecture
┌─────────────────────────────────────────────┐ │ IoT Devices / Sensors │ │ (MQTT, HTTP, WebSocket) │ └──────────────────┬──────────────────────────┘ │ ┌─────────▼─────────┐ │ Data Ingestion │ │ (MQTT Broker + │ │ HTTP Receiver) │ └─────────┬─────────┘ │ ┌─────────▼─────────┐ │ Time-Series DB │ │ (TimescaleDB / │ │ InfluxDB) │ └─────────┬─────────┘ │ ┌─────────▼─────────┐ │ Real-Time Engine │ │ (SSE / WebSocket)│ └─────────┬─────────┘ │ ┌──────────────┼──────────────┐ │ │ │ ┌───▼───┐ ┌────▼────┐ ┌────▼────┐ │Dashboard│ │ Alert │ │ API │ │Builder │ │ Engine │ │ Server │ └───────┘ └─────────┘ └─────────┘
Technology Choices
| Component | Technology | Why |
|———–|———–|—–|
| MQTT broker | Mosquitto | Lightweight, widely used in IoT |
| Backend | Node.js + Express | Good WebSocket/SSE support |
| Time-series DB | TimescaleDB (PostgreSQL extension) | SQL-compatible, no new query language |
| Real-time | Server-Sent Events | Simpler than WebSocket for one-way push |
| Frontend | React + D3.js | Flexible charting, drag-and-drop support |
| Drag-and-drop | react-grid-layout | Proven dashboard layout library |
| Alerts | Node-cron + nodemailer | Scheduled threshold checks |
MVP Scope
MQTT device registration and data ingestionAutomatic schema discovery from sensor dataDrag-and-drop dashboard builder with 3 widget types (line chart, gauge, value)Real-time data updates via SSEHistorical data storage and time-range selectionBasic alert rules (threshold notifications)Implementation Approach
Phase 1: Data Pipeline (Weeks 1-2)
Build the MQTT ingestion layer and TimescaleDB storage. Register devices, accept sensor data, store with timestamps. Build the automatic schema discovery that infers data types from incoming payloads.
Phase 2: Dashboard Builder (Weeks 3-4)
Build the React frontend with react-grid-layout. Create the drag-and-drop widget placement system. Implement line chart, gauge, and value display widgets that bind to data streams.
Phase 3: Real-Time Engine (Weeks 5-6)
Implement Server-Sent Events for live data push. Connect the ingestion pipeline to the dashboard renderer. Add historical data queries with time-range selection.
Phase 4: Alerts and Polish (Weeks 7-8)
Build the alert rule system with threshold configuration. Add email and webhook notifications. Implement responsive design, device grouping, and embeddable dashboard export.
Challenges and Tradeoffs
- Data volume — High-frequency sensors (accelerometers, gyroscopes) can produce thousands of readings per second. The ingestion pipeline must handle backpressure without losing data. Rate limiting and downsampling are necessary for extreme cases.
- Connection reliability — IoT devices frequently disconnect and reconnect. The system must handle reconnections gracefully without losing in-flight data or creating duplicate entries.
- Storage growth — Time-series data grows quickly. Implement automatic data retention policies (e.g., downsample data older than 30 days, delete raw data older than 1 year).
- Widget performance — Rendering hundreds of real-time widgets simultaneously can strain browser performance. Implement virtual rendering and throttled updates for dashboards with many widgets.
Why This Idea Is Different
Most IoT visualization falls into two categories: (1) commercial platforms like ThingSpeak and Blynk that offer pre-built widgets but lock you into their ecosystem, pricing, and data retention; or (2) enterprise stacks like Grafana + InfluxDB + Telegraf that are powerful but require significant DevOps knowledge to configure.
This Idea focuses on the maker/hobbyist/prototyping audience: connect a sensor and see data immediately, with enough customization to make the dashboard useful without requiring a month of infrastructure setup. The automatic schema discovery is the key differentiator — it removes the configuration overhead that makes existing tools feel heavy.
| Tool | Approach | Limitation |
|——|———-|————|
| ThingSpeak | Cloud IoT platform | Limited widgets, MathWorks ecosystem lock-in |
| Blynk | Mobile IoT dashboard | App-focused, limited web customization |
| Grafana | Open-source dashboard | Complex setup, requires multiple services |
| Adafruit IO | Maker IoT platform | Basic widgets, cloud-dependent |
| Node-RED | Flow-based programming | Requires flow design, not visual dashboard |
This Idea fills the gap between simple cloud platforms and complex open-source stacks.
Technology Stack
- Node.js 18+ — Backend runtime
- Express — HTTP API server
- Mosquitto — MQTT broker (can be embedded)
- TimescaleDB — Time-series storage (PostgreSQL extension)
- React 18 — Dashboard frontend
- D3.js — Data visualization
- react-grid-layout — Drag-and-drop dashboard layout
- Server-Sent Events — Real-time data push
- Docker — Containerized deployment
Future Extensions
- InfluxDB support — Alternative time-series backend for users already running InfluxDB
- Grafana plugin — Export dashboards as Grafana-compatible JSON
- Mobile app — Native iOS/Android app for dashboard viewing
- Voice assistants — “Alexa, what’s the greenhouse temperature?” via MQTT bridge
- Machine learning — Anomaly detection on sensor data patterns
- Multi-tenant — Support multiple users with shared device access
- Edge deployment — Run the entire stack on a Raspberry Pi for offline dashboards
Browse more IoT ideas · Project Ideas