Home Energy Disaggregation from Smart-Meter Data
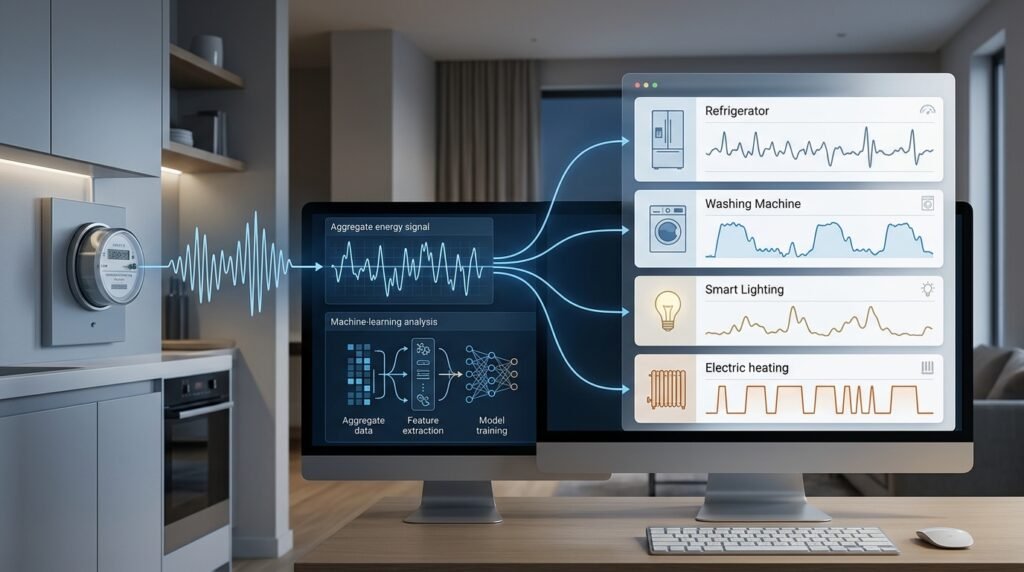
An advanced signal-processing and machine-learning project in non-intrusive load monitoring (NILM): given only the aggregate power signal from a home’s electricity meter, estimate how much energy individual appliances consumed — without any per-appliance sensors. You will work with the open UK-DALE dataset, which records whole-house demand alongside appliance-level submeter readings from real homes, build the classic disaggregation pipeline (preprocessing → windowing → features → sequence models → evaluation), and finish with an honest analysis of which appliances your models can separate and which they cannot. It is one of the richest self-contained time-series problems a student can take on: real physics, real noise, real homes.
>Estimates, not meter readings. Disaggregation output is statistical inference from a shared signal: it can be wrong, systematically so for appliances with similar signatures. Present results as approximations for study and exploration — never as billing-grade measurements, and never as evidence of what happened in a specific home at a specific time. Smart-meter data is behavioral data; treat it with the privacy discipline described below.
Who Is This For?
- Energy-engineering and EE students who want a rigorous applied project on real power data
- Smart-grid researchers exploring NILM baselines with an established public dataset
- ML practitioners looking for a sequence-modeling problem with genuinely structured signals
- Sustainability-minded makers who want to understand what a smart meter can and cannot reveal
The Problem
A household electricity meter reports one number: total power drawn, right now. Appliance-level insight — which devices drive the bill, when they run, which are worth upgrading — traditionally requires submetering hardware installed per device, which most homes will never have. Energy disaggregation (NILM) tackles this with software alone: it exploits the fact that appliances leave recognizable fingerprints in the aggregate signal (a kettle’s sharp 2–3 kW step, a fridge’s periodic compressor cycle, a washing machine’s staged sequence) and attempts to decompose the whole into its parts. It is a genuinely hard inference problem — the signal is noisy, appliances overlap, and homes differ — which makes it an excellent vehicle for learning time-series modeling done honestly.
How It Works
The pipeline follows the established NILM structure. The dataset work comes first because NILM lives or dies on signal hygiene.
1. Understand the UK-DALE Dataset
UK-DALE records real UK homes with a whole-house meter plus per-appliance submeters — the ground truth that makes supervised disaggregation possible. Download the channels you need (whole-house plus a handful of clearly distinguishable appliances: kettle, fridge, washing machine, dishwasher, microwave), and inspect before modeling: sampling rates (channels differ — high-frequency whole-house data and lower-rate appliance channels), gaps and dropouts, timestamp alignment, and per-appliance on-power signatures. The dataset’s documentation describes its structure and access path; read it and record exactly which recordings and date ranges you use, because reproducibility depends on it.
2. Preprocess and Align
Resample all channels to a common, modest rate (NILM work commonly uses 6-second aggregates; the dataset provides low-rate versions suitable for this). Handle missing intervals explicitly — build masks rather than interpolating silently — and align appliance channels to the mains channel on a common time grid. Compute each appliance’s on-power statistics and duty cycle; you will use them both for labeling and for sanity-checking model output later.
3. Create Windows and Labels
Slice the aligned series into fixed windows (for example, a few minutes of aggregate signal per sample). For each window, derive the target: a per-appliance on/off sequence or an energy-share vector, depending on your model family. Define “on” from each appliance’s recorded on-power (a kettle is on only above a clear wattage threshold), and check class balance — some appliances run rarely, and your splits must reflect that.
4. Engineer Features or Go End-to-End
Two legitimate routes, both instructive. Feature-based: extract edge detection, steady-state transitions, and window statistics, then classify events or regress power shares with gradient-boosted trees or logistic models — interpretable and cheap. Sequence models: train an HMM per appliance (the classic factorial-HMM baseline) or a neural sequence model (seq2seq/seq2point-style CNNs or RNNs) that maps aggregate windows to appliance sequences. Implement the simple baseline first; it calibrates expectations and often embarrasses careless neural variants.
5. Split Like a Researcher
Split by time (train on early months, test on later ones) and, where the dataset supports it, by home — train on some houses, test on another. Random window splits leak appliance routines across the boundary and produce inflated numbers. The home-transfer split, in particular, teaches the central NILM lesson: signatures vary between households, and models that only memorized one home’s patterns fail honestly.
6. Evaluate Per Appliance, Honestly
Report per-appliance MAE on power and F1 on on/off detection — never a single blended score. Show which appliances work (high-power, distinctive loads like kettles) and which do not (low-power or similar-signature loads), with confusion between similar appliances quantified. Add energy-rank accuracy over a day or week: does the model at least rank appliance consumption correctly, even when instantaneous estimates wobble? This rank view is often the most honest useful summary.
7. Build the Explorer and Persist Results
Store predictions and metrics in a small database (runs, models, per-appliance results), and build a viewer that plots aggregate signal with overlaid per-appliance estimates for any test window. Being able to see a wrong decomposition is the fastest route to understanding model failure — and the feature that turns a notebook into a project.
Key Features
- Whole-signal ingestion from UK-DALE mains and appliance channels with explicit gap handling
- Two model families — interpretable feature/event baseline and neural sequence models — compared on equal splits
- Per-appliance evaluation — MAE, on/off F1, and daily energy-rank accuracy
- Home-transfer and time splits — honest generalization tests, not random-window leakage
- Disaggregation viewer — overlay per-appliance estimates on the aggregate signal for any window
- Run registry — every training run’s config, data range, and metrics stored for comparison
Functional Requirements
- Load, resample, and align UK-DALE mains and appliance channels to a common time grid
- Generate labeled windows with configurable appliances, window lengths, and on-thresholds
- Train and compare at least one feature-based baseline and one sequence model
- Evaluate per appliance on time and home-transfer splits; persist all metrics
- Render aggregate-vs-estimate overlays and per-appliance error summaries
- Export a run report (data ranges, config, metrics, known limitations)
User Stories
- As an energy student, I want per-appliance F1 and MAE so I can see which loads NILM separates realistically.
- As a researcher, I want a home-transfer split so my reported numbers reflect cross-household reality.
- As a maker, I want to overlay model output on my own (or dataset) mains signal so I can debug decompositions visually.
- As an ML practitioner, I want the feature baseline included so my neural model’s value is demonstrated, not assumed.
- As a privacy-conscious builder, I want the pipeline to run on local data only so household recordings never leave my machine.
MVP Scope
A minimal but complete MVP:
Three or four visually distinct appliances from one or two UK-DALE homes at 6-second resolutionWindowing, labeling, and a time-based train/test splitOne feature/event baseline and one neural sequence modelPer-appliance MAE and on/off F1 on held-out data, persisted with run configsA viewer overlaying estimates on the aggregate signal, plus a limitations reportExplicitly out of MVP: many-appliance joint models, online/streaming inference, cross-dataset transfer, unsupervised disaggregation, and any integration with a real home’s live meter. All are strong extensions; none are MVP obligations.
Project Timeline
- Week 1: dataset acquisition and structure study; channel selection; resampling and alignment
- Week 2: windowing/labeling; feature baseline; first honest metrics
- Week 3: sequence model; time vs home-transfer splits; error analysis
- Week 4: viewer, run registry, energy-rank evaluation, limitations report, polish
Testing Strategy
- Signal tests: resampling preserves totals within tolerance; alignment asserts on known appliance events; gap masks cover all missing intervals
- Label tests: on-thresholds reproduce expected appliance run counts on sampled windows
- Model tests: metrics reproduce under fixed seeds; per-appliance metrics computed on identical held-out windows across model families
- Leakage guard: an automated check asserts test windows do not overlap training ranges (time split) and test homes are absent from training (home split)
Security and Privacy Considerations
- Smart-meter data is behavioral data — run patterns reveal presence, routines, and appliance ownership. Keep the entire pipeline local; do not upload dataset recordings or any real household data to third-party services
- Practice data minimization: work with the subset of channels and date ranges you actually need, and set retention limits on intermediate files
- If you ever record your own home’s data, secure it at rest (encrypted disk or container), restrict access, and delete raw recordings once features are extracted
- Do not present inferred activity as fact; the models estimate appliance power, not what a household did — and the write-up should say so explicitly
- Never point this pipeline at someone else’s meter data without their informed consent
Success Metrics
- Both model families trained and evaluated on identical, leakage-free splits
- Per-appliance MAE and on/off F1 reported for every selected appliance, with failure cases analyzed
- At least one home-transfer result demonstrating cross-household generalization honestly
- The viewer reproduces any persisted run’s overlay from stored config and predictions
- The limitations report names the appliances that resist disaggregation and explains why
Common Challenges
- Signature ambiguity — low-power or similar-shaped loads (two heaters, idle electronics) resist separation; quantify the confusion rather than hiding it
- Sampling-rate traps — mixing high-rate and low-rate channels without proper alignment corrupts labels; align first, model second
- Leakage temptation — random window splits inflate results; enforce time/home splits mechanically
- Baseline humility — the feature/event baseline can rival neural variants on distinctive appliances; report both, learn from the comparison
- Compute appetite — neural sequence models on long recordings are heavy; subsample windows, use a modest architecture, and budget training time honestly
Learning Objectives
- Understand NILM: what aggregate signals encode, why decomposition is possible, and where it fails
- Build a complete time-series ML pipeline: alignment, windowing, labeling, modeling, leakage-safe evaluation
- Compare interpretable and neural approaches on equal footing and interpret the gap
- Practice behavioral-privacy discipline on real household-scale data
- Communicate energy findings with rank-level honesty instead of inflated accuracy claims
Why This Idea Is Different
This project decomposes one signal into many appliances — a source-separation problem — and it is distinct from every neighbor it might be confused with. The Predictive Maintenance Alert System for Industrial Sensors forecasts equipment degradation from multivariate industrial sensor histories; #062 has no failure notion at all — its target is consumption attribution in a home. The Real-Time IoT Dashboard Builder visualizes device streams but applies no model; #062’s core is the model. And the Inventory Forecasting for Small Ecommerce project forecasts future demand from sales history — prediction over time — whereas disaggregation infers hidden composition within the present signal. Different data, different question, different failure modes.
| Tool type | Approach | Limitation |
|———–|———-|————|
| Commercial NILM services | Vendor platforms bundling utility data | Closed models; not inspectable or trainable by students |
| Research codebases | NILM reference implementations | Research-grade; heavy setup; rarely tutorial-oriented |
| Energy-monitor hardware | Per-device smart plugs | Accurate but costs money per outlet; the exact friction NILM avoids |
| Utility billing portals | Monthly aggregate views | No appliance insight whatsoever |
This project’s differentiators: a student-buildable pipeline on an established open dataset, two model families compared under leakage-safe splits, per-appliance honesty (MAE + F1 + energy rank), and explicit behavioral-privacy handling.
Technology Stack
- Python — the whole pipeline
- pandas / numpy — resampling, alignment, windowing
- scikit-learn — feature/event baseline models and metrics
- PyTorch — neural sequence models (CNN/RNN families)
- hmmlearn — the classic per-appliance HMM baseline
- SQLite — run registry and results storage
- matplotlib / Plotly + Streamlit — overlays and the viewer
Future Enhancements
- More appliances and homes, with a measured scaling study of where disaggregation breaks down
- Cross-dataset evaluation on a second public NILM dataset to test transfer beyond UK-DALE
- Seq2seq attention variants with faithful uncertainty estimates per time step
- Energy-rank dashboard over a full test month with per-day summaries
- An on-device demo: quantized model estimating appliance loads from a live (consented) meter feed
Browse more Project Ideas · Advanced Ideas · IoT Ideas