Inventory Forecasting for Small E-commerce
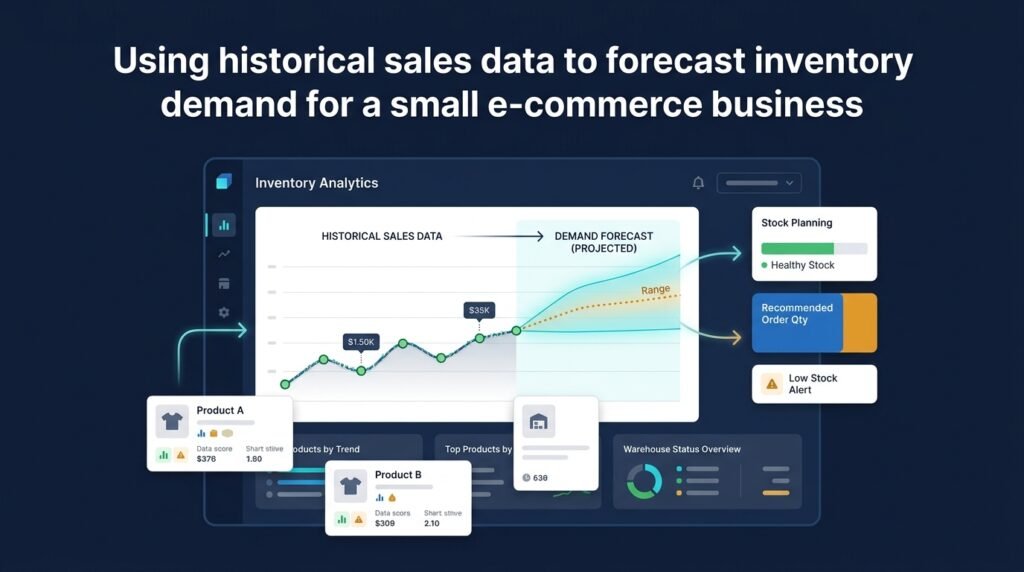
A lightweight, explainable demand-forecasting tool for small e-commerce retailers. It imports your sales history, builds a simple per-SKU forecast with seasonality and lead-time awareness, and outputs reorder suggestions with confidence ranges — in plain language, not an enterprise demand-planning suite.
Who Is This For?
- Small e-commerce owners selling through Shopify, WooCommerce, or marketplaces
- Marketplace sellers (Amazon, Etsy) juggling dozens of SKUs and reorder decisions
- Indie operators who currently forecast “by feel” or in a spreadsheet
- Students learning applied time-series forecasting (baselines, seasonality, error metrics)
- Developers building lightweight analytics tools for small-business niches
The Problem
Large retailers use enterprise demand-planning platforms with dedicated forecasting teams. Small retailers get the worst of both worlds:
- Spreadsheets — a tab of formulas that grows unmanageable and can’t handle seasonality or lead times across many SKUs.
- Enterprise software — priced and sized for organizations with a supply-chain team; a solo operator running a 200-SKU shop cannot justify it.
- Gut feel — an experienced owner knows their products, but intuition degrades as catalog size grows, and there is no record of why a decision was made.
The practical failure modes are familiar: best-selling SKUs run out during a seasonal peak because nobody saw it coming, while slow movers tie up cash in stock that sits for months. Both problems are forecasting problems, and both are solvable with surprisingly simple models — if the tool is built for a small retailer’s constraints.
How It Works
The tool follows a four-step pipeline: import → forecast → recommend → explain.
1. Import Sales History
Sales history comes from a CSV export or a platform API (Shopify, WooCommerce, marketplace reports). The tool normalizes it into a per-SKU daily demand series. Users specify lead time (days from order to arrival) per SKU or per supplier — or the tool estimates it from purchase-order history when available.
2. Per-SKU Forecasting
Each SKU gets a forecast built from simple, explainable methods rather than a black box:
- Baselines — naive (last period repeats) and seasonal-naive (same period last year repeats) serve as sanity references.
- Seasonality decomposition — weekly patterns and month-of-year effects are detected from the demand series where enough history exists.
- Trend + seasonality models — a simple additive model (level + trend + seasonal component) fits most small-retail SKUs; exotic models are deliberately avoided for v1.
3. Reorder Suggestions
Forecasts feed a reorder-point calculation that accounts for lead time and desired service level:
- Reorder point = expected demand during lead time + safety stock
- Safety stock grows with demand variability and the chosen service level
- Output: a suggested reorder quantity, a suggested reorder date, and a confidence range around the forecast
4. Explainable Output
Every number comes with a plain-language explanation: “This SKU’s forecast is driven by a strong December peak and a recent upward trend; demand is highly variable, so safety stock is set high.” Users can see why the tool suggests what it suggests — essential for a tool meant to support, not replace, business judgment.
┌────────────┐ ┌──────────────┐ ┌──────────────────┐ ┌─────────────────┐ │ Sales │──▶│ Normalize │──▶│ Per-SKU │──▶│ Reorder + │ │ CSV / API │ │ per-SKU │ │ Forecast │ │ Confidence │ └────────────┘ └──────────────┘ │ (baseline + │ │ Ranges │ │ seasonality) │ └────────┬────────┘ └──────────────────┘ │ ┌───────────▼─────────┐ │ Explainable │ │ Report ("driven by │ │ these 3 factors") │ └─────────────────────┘
Core Workflow
Connect — upload a CSV or connect a platform export.Review — the tool shows data quality (gaps, zero-demand SKUs) before forecasting.Forecast — per-SKU models run with baselines for comparison.Recommend — reorder quantities, dates, and confidence ranges.Explain — each suggestion states its driving factors.Key Features
- CSV/platform import — works with whatever data the retailer can export
- Per-SKU seasonality detection — weekly and monthly patterns where history allows
- Lead-time-aware reorder points — safety stock sized from demand variability
- Confidence intervals — every forecast shows a range, not a false-precision single number
- Baseline comparison — the model is always shown against naive/seasonal-naive baselines
- Explainable output — “forecast driven by these factors” in plain language
- What-if stock levels — test “what if I set service level to 95%?” before committing
Functional Requirements
Import per-SKU daily sales from CSV (date, SKU, quantity) with clear validation errors.Handle zero-demand periods and missing dates without distorting forecasts.Produce per-SKU forecasts for a configurable horizon (e.g., 8 weeks).Compute naive and seasonal-naive baselines for comparison on every SKU.Calculate reorder points from forecast, lead time, variability, and service level.Emit confidence ranges for all forecast outputs.Render an explainability note per SKU listing the top driving factors.User Stories
- As a shop owner, I want to see a forecast for each SKU with a confidence range, so that I know when a number is solid and when it is a guess.
- As a retailer with seasonal products, I want the tool to recognize seasonal peaks, so that I don’t run out of winter stock in December.
- As a non-technical user, I want each suggestion explained in plain language, so that I can trust (or override) the tool with my own judgment.
MVP Scope
CSV import with validation and a data-quality report.Naive + seasonal-naive baselines and a simple level/trend/seasonality model per SKU.Reorder-point calculation with lead time and service level.Confidence ranges on forecasts.Plain-language explainability notes.A simple web dashboard or notebook-style report for review.An API, multi-warehouse support, and automated purchase-order generation are second-phase additions.
Project Timeline
- Phase 1 — Research (Week 1): Define the model scope (baselines + simple seasonality), collect sample retail datasets, and settle on error metrics (MAPE/WAPE) for evaluation.
- Phase 2 — MVP (Weeks 2–4): Import pipeline, per-SKU models, reorder logic, confidence ranges, explainability.
- Phase 3 — Testing (Week 5): Evaluate forecasts against baselines on held-out data; unit-test reorder math; usability-test the explainability notes.
- Phase 4 — Deployment (Week 6): Package for self-hosting or a simple SaaS tier; onboard a small pilot retailer.
- Phase 5 — Improvements (Ongoing): Platform integrations, what-if scenarios, more sophisticated models behind the same explainable UI.
Testing Strategy
- Baseline evaluation — on held-out periods, the chosen model must beat or match naive/seasonal-naive baselines on MAPE/WAPE; if it does not, fall back to the better baseline for that SKU.
- Reorder-math tests — hand-computed reorder points for known demand series and lead times.
- Import-failure tests — malformed CSVs, missing dates, and negative quantities fail with clear messages.
- Edge-case tests — SKUs with a single sale, zero demand, or extreme spikes must not crash the model or produce absurd ranges.
- Explainability tests — every output includes a factor list; verify it changes when inputs change.
Deployment Considerations
- Self-hosted first — a single small server (or even a scheduled batch run) is enough for a small retailer; batch runs nightly or weekly.
- SaaS path — if it becomes a product, start with a pilot retailer before building billing, onboarding, and platform integrations.
- Small compute — per-SKU models are cheap; a 1,000-SKU catalog forecasts in minutes on a single machine.
Security Considerations
- Sales data is commercially sensitive; the tool must be deployable on the retailer’s own infrastructure.
- No data leaves the deployment without explicit user action.
- Platform API credentials are stored securely (environment variables/secret manager), never in exports or logs.
Privacy Considerations
- The tool processes the retailer’s sales history only; it collects no browsing data, no customer personal data, and no analytics about its users.
- Forecasts and reports are derived from the retailer’s own data and remain theirs.
Cost Considerations
- For the user — a single low-cost VPS (or even a laptop for batch runs) covers a small catalog; no per-SKU enterprise licensing.
- For the builder — the MVP is buildable with free-tier tooling; the main cost is time, not infrastructure.
- Be honest in the product: the tool does not promise to reduce inventory costs or increase revenue — it promises better-informed reorder decisions.
Success Metrics
- Forecast quality — the chosen model matches or beats naive baselines on MAPE/WAPE for the majority of SKUs.
- Adoption — the pilot retailer keeps using it weekly (retention, not downloads).
- Explainability — users can state why a suggestion was made after reading it.
- Decision support — a documented reduction in stockouts/overstock if the pilot validates it — reported as an outcome, not a guarantee.
Common Challenges
- Short, sparse histories — new SKUs have no seasonality to detect; the tool must gracefully fall back to baselines.
- Zero-demand SKUs — gaps are common; the tool must distinguish “no data” from “no demand.”
- Changing catalogs — discontinued SKUs and new variants break continuity; forecasts must be labeled as such.
- Model vs. baseline honesty — when a simple baseline wins, the tool should say so; explainability beats false sophistication.
Learning Objectives
- Applied time-series basics: naive baselines, seasonality decomposition, trend/level models.
- Forecast evaluation: MAPE, WAPE, held-out validation, and why baselines matter.
- Reorder-point and safety-stock reasoning under lead-time uncertainty.
- Building explainable analytics for a non-technical audience.
Why This Idea Is Different
Enterprise demand planning is a black box priced for supply-chain teams. This idea is lightweight and explainable by design: every forecast comes with a confidence range, every model is compared against a baseline, and every suggestion states its driving factors. It is built for a solo operator’s constraints — CSV import, a small server, plain-language output.
It shares sales-history context with the AI Product Recommendation Engine for Small Retailers and the E-commerce Product Review Sentiment Analyzer, but solves a different problem: not what to recommend or what customers say, but how much to buy and when. The three form a coherent suite for the same small retailer.
An honest boundary: this is a decision-support tool, not a guarantee. Forecasts are estimates derived from historical patterns; they support business judgment, they do not replace it. No tool can promise reduced costs, higher revenue, or accurate predictions — and this one doesn’t. It promises a clear view of what the data says, with the uncertainty shown.
| Tool | Approach | Limitation |
|——|———-|————|
| Enterprise demand planning | Full platform with consultants | Priced/sized for large orgs; opaque models |
| Spreadsheet forecasting | Manual formulas | Doesn’t scale across SKUs; no seasonality handling |
| Inventory apps | Reorder alerts from static rules | No forecasting; can’t see peaks coming |
| Marketplace dashboards | Platform-provided analytics | Tied to one platform; limited forecast depth |
This idea’s differentiators: lightweight deployment, explainable output, confidence ranges, and honest baseline evaluation.
Technology Stack
- Python 3.10+ — modeling and pipeline
- pandas — demand-series normalization
- statsmodels — seasonal decomposition and simple time-series models
- scikit-learn — where needed for model fitting/evaluation
- FastAPI — optional lightweight API/report serving
- pytest — baseline-evaluation and reorder-math tests
Future Enhancements
- Platform integrations — Shopify/WooCommerce/marketplace API connectors
- What-if scenarios — service level, lead time, and batch-size simulations
- Multi-warehouse support — per-location forecasts and transfers
- Purchase-order generation — draft POs from reorder suggestions (with human approval)
- More models — Prophet-style or ML approaches behind the same explainable, baseline-checked UI
Browse more E-commerce ideas · Startup Ideas