Predictive Maintenance Alert System for Industrial Sensors
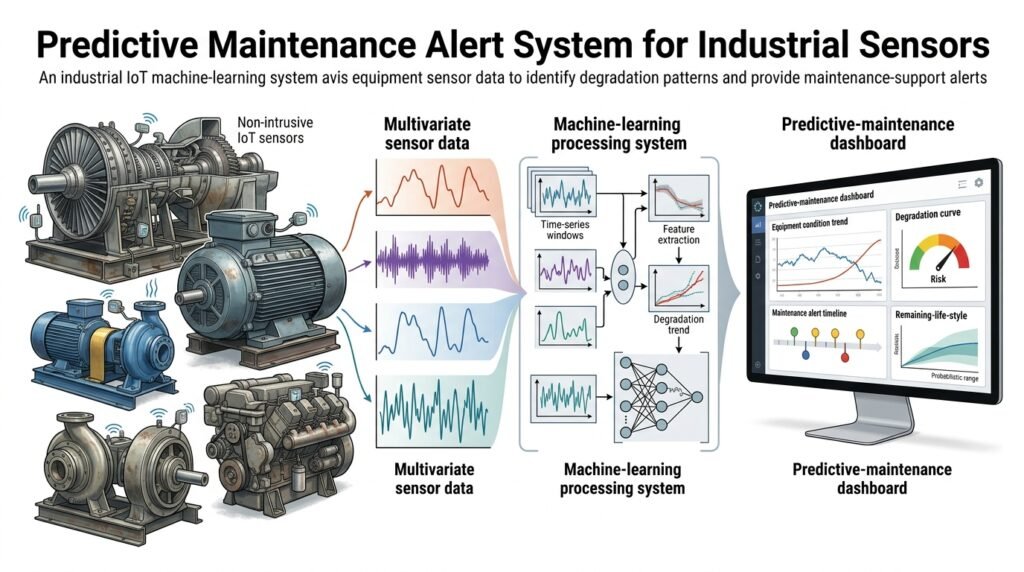
A machine-learning project that watches multivariate industrial sensor time series and raises maintenance-support alerts as equipment health degrades. Trained on NASA’s public C-MAPSS turbofan engine simulation data — multivariate sensor readings recorded from healthy operation to failure — the system learns what degradation looks like, estimates a risk level or remaining-useful-life style figure for a running asset, and fires threshold-based alerts into a maintenance dashboard. It is a decision-support prototype for reliability workflows: the alert says “this asset deserves attention soon,” and a human decides what happens next.
>Decision support, not a crystal ball. This system does not guarantee failure prediction, uptime, or accident prevention, and it is not a safety-certified product. Alerts are advisory; trained maintenance staff make the actual decisions using the alert as one input among many — inspection schedules, operating context, and professional judgment.
Who Is This For?
- Reliability and maintenance engineers exploring what ML-based early warning can and cannot add to their programs
- Industrial IoT developers who collect sensor streams and want a principled path from raw telemetry to alerts
- OT/IIoT students seeking a complete, reproducible predictive-maintenance project on a legendary public dataset
- ML learners ready for time-series work beyond single-variable forecasting
The Problem
Unplanned equipment failure is expensive: emergency repairs cost multiples of scheduled ones, and downtime ripples through production. Maintenance programs therefore evolved from “fix it when it breaks” (reactive) to “fix it on a schedule” (preventive) — but fixed schedules over-maintain healthy equipment and can still miss early failures. The promise of predictive maintenance is to use the sensor streams industrial equipment already produces to focus attention where degradation actually appears. The catch: most public content stops at “plot the sensor data,” and real deployments are closed-source. What’s missing is a buildable, honest reference implementation — one that shows the full path from raw multivariate telemetry to a threshold-based alert, including the leakage traps and false-alarm economics that decide whether such a system is useful at all.
How It Works
Predictive maintenance is a family of related problems, and the distinctions matter:
- Anomaly detection flags readings that look unusual relative to normal operation — no notion of how much life remains
- Degradation prediction models health as it worsens over a run — the trend, not just the outlier
- Remaining-useful-life (RUL) estimation predicts how many operating cycles remain before a maintenance-relevant threshold
- Maintenance alerting converts the above into actionable signals with thresholds, hysteresis, and human-facing context
This project builds the degradation→RUL-style→alert chain on simulated run-to-failure data, where each “asset” is a unit whose sensors were recorded until it failed — which makes supervised training possible and reproducible.
1. Inspect the Data
C-MAPSS provides multiple multivariate time-series subsets: per-unit sensor readings (temperature, pressure, speed, and other simulated channels) over operational cycles, ending at failure for training units and cut mid-life for test units. Start with inspection: how many units, how many cycles per unit, sensor value ranges, which channels are flat or noisy, and what degradation actually looks like when you plot a few units end to end. Plot first, model second.
2. Preprocess with Time Discipline
Compute a health label per cycle (for training units, a remaining-cycles count derived from the run-to-failure records; capped to avoid asymptotic distortion). Normalize sensor channels using training-set statistics only. Then split by unit, never by random rows: putting cycles from the same engine in both train and test is temporal leakage, and it is the single most common way predictive-maintenance projects lie to themselves.
3. Engineer Features Over Rolling Windows
Single-cycle readings are noisy; degradation lives in trends. Build rolling-window features per unit: windowed means, standard deviations, slopes, and deltas over the recent past for each sensor channel. The window length is a real modeling decision — too short and noise dominates, too long and early degradation is smoothed away. Windowed features also make the eventual alerting behave sensibly, because alerts keyed to smoothed signals fire less erratically than alerts keyed to single spikes.
4. Train a Supervised Degradation Model
With windowed features and per-cycle health labels, train a regression model (gradient-boosted trees are a strong, interpretable baseline; a small sequence model is the natural upgrade) to estimate remaining cycles — or a classification variant that predicts whether the unit is within a near-failure window. Start with regression on capped RUL: it is easier to evaluate honestly and maps naturally onto alert thresholds.
5. Evaluate Like an Operator, Not Only Like a Data Scientist
Standard regression metrics (MAE, RMSE) are necessary but not sufficient. Operators care about alert behavior: how often does the system cry wolf (false positives), how often does it miss a genuine near-failure (false negatives), and how early does the warning arrive (lead time)? Evaluate with alert-style metrics — precision/recall of “alerted before threshold” events and average lead time — alongside the regression metrics.
6. Set Alert Thresholds with Hysteresis
Convert model output into alerts via thresholds with hysteresis: enter the alert state above a risk level, exit below a lower one. Hysteresis prevents the flapping that destroys operator trust on the first week of use. Tune thresholds on validation data, and report the false-positive/false-negative trade-off explicitly rather than burying it.
7. Persist, Serve, and Visualize
Store per-unit features, predictions, and alert states in a database (any relational store works; time-series-friendly schemas keep queries fast). A small dashboard shows per-unit health over time, current risk, alert history, and the raw sensor context behind each alert — because an alert without its evidence trail is an alert operators will ignore.
Key Features
- Multivariate degradation model over rolling-window sensor features
- RUL-style risk estimate per asset per cycle, with capped-label training
- Threshold alerts with hysteresis — stable states instead of flapping
- Alert-quality metrics — false positives, false negatives, and lead time reported alongside MAE/RMSE
- Maintenance dashboard — health timelines, alert history, and the sensor evidence behind each alert
- Unit-level data hygiene — splits, normalization, and leakage controls enforced in code
Functional Requirements
- Load and inspect C-MAPSS-style multivariate run-to-failure subsets
- Compute per-cycle health labels from run records; cap labels to a configurable maximum
- Generate rolling-window features per unit with configurable window lengths
- Train and evaluate a supervised degradation model with unit-level splits
- Emit alerts via thresholds with hysteresis; persist predictions and alert states
- Dashboard: per-unit health curve, current risk, alert log with sensor context, and exportable evaluation report
User Stories
- As a reliability engineer, I want lead-time metrics so I can judge whether the warnings arrive early enough to matter.
- As an IoT developer, I want the feature pipeline scripted and configurable so I can adapt it to our sensor names and rates.
- As an OT student, I want to see the leakage traps documented in code comments so I do not repeat them in production.
- As a maintenance planner, I want an alert history with sensor evidence so I can sanity-check each alert before acting.
- As a data scientist, I want false-positive/false-negative curves for different thresholds so the alert policy is a documented choice, not a default.
MVP Scope
A minimal but complete MVP:
Load one C-MAPSS subset; inspect and plot several units end to endBuild capped health labels, unit-level splits, and rolling-window featuresTrain one gradient-boosted regression model for remaining-cycles estimationEvaluate with MAE/RMSE plus alert-style metrics (precision/recall at threshold, lead time)Persist predictions and alerts in a database; dashboard shows health curves, current risk, and an alert timelineExplicitly out of MVP: streaming ingestion, multi-fleet deployment, anomaly-detection ensembles, and any real-facility integration. All are natural extensions.
Project Timeline
- Week 1: data inspection, label construction, unit-level splits, baseline features
- Week 2: model training, regression evaluation, leakage verification
- Week 3: alert thresholds, hysteresis, alert-quality metrics
- Week 4: database persistence, dashboard, evaluation report, polish
Testing Strategy
- Leakage tests: assert no unit appears in more than one split; assert normalization statistics come from training data only
- Model tests: metrics reproduce under a fixed seed; per-unit prediction plots archived for regression comparison
- Alert tests: hysteresis state machine behaves (enter/exit thresholds, no flapping on boundary noise); synthetic degradation ramps trigger alerts with expected lead times
- Data tests: feature windows never read beyond a cycle’s available history (no future peeking)
- Dashboard tests: an alert row renders with its sensor context; the alert timeline matches the persisted alert log
Security and Privacy Considerations
- Industrial sensor data can be operationally sensitive — production names, unit IDs, and failure histories reveal capability and downtime patterns. Keep the public project on the simulated dataset; if adapting to real facilities, keep credentials in environment variables, never in code, and aggregate or anonymize anything shown beyond the maintenance team.
- Do not expose real facility layouts, production volumes, or vendor-identifying failure records in demos or screenshots.
- The alert system must never page emergency services or shut down equipment autonomously — it informs humans; it does not act.
- Keep the model card explicit: trained on simulation (C-MAPSS), validated only on that simulation, and not certified for any safety-relevant use.
Success Metrics
- A trained model with measured MAE/RMSE on a held-out, unit-level test split (your own numbers)
- Alert-quality metrics reported for at least three threshold settings, with the chosen policy justified
- Zero leakage findings in the leakage test suite
- The dashboard renders health curves, risk, and alert history for every unit in the test set
- The model card documents the simulation-only scope and the human-in-the-loop boundary
Common Challenges
- Temporal leakage — the classic failure mode; unit-level splits and training-only normalization statistics are the defenses, and both must be tested
- Label curation — raw remaining-cycles labels explode near failure; capping makes the learning problem tractable and evaluation stable
- Sim-to-real domain shift — C-MAPSS is simulation; real sensors drift, regimes change, and failures look different. Document this gap; do not paper over it
- Alert economics — too sensitive and operators tune out; too quiet and failures slip through. The threshold choice is a business decision supported by data, not a hyperparameter to silently tune
- Regime changes — operational settings alter sensor baselines; features conditioned on operating regime handle this better than raw values
Learning Objectives
- Distinguish anomaly detection, degradation prediction, RUL estimation, and alerting — and know what each can honestly claim
- Build time-aware ML: unit-level splits, rolling windows, training-only normalization, no future peeking
- Evaluate alerts as an operator would: false positives, false negatives, and lead time, not just regression error
- Implement a hysteresis-based alerting state machine that earns operator trust
- Document scope honestly: simulation-trained, advisory-only, human-in-the-loop
Why This Idea Is Different
This project is deliberately distinct from the site’s Cloud Cost Anomaly Detector: #025 flags unusual spending patterns in cloud billing data using unsupervised anomaly detection, while #058 learns degradation trajectories from multivariate industrial sensor time series using supervised, remaining-useful-life-style modeling — different data (billing records vs sensor telemetry), different method (anomaly scoring vs supervised degradation regression), and different decision (cost review vs maintenance scheduling). It also extends the Real-Time IoT Dashboard Builder, which visualizes device telemetry but does not model it: #058 adds the intelligence layer — features, prediction, and threshold-based alerts — on top of the telemetry those dashboards display. The Smart Data Pipeline Monitor watches data pipelines for freshness and breakage; #058 watches machines for degradation.
| Tool type | Approach | Limitation |
|———–|———-|————|
| Enterprise predictive-maintenance platforms | Vendor suites with proprietary models | Expensive, opaque, not student-buildable |
| SCADA alarm systems | Static rule thresholds on sensor values | No trend learning; alarm floods; no lead-time view |
| Generic anomaly detectors | Unsupervised outlier scoring | No degradation trend, no remaining-life notion, no alert policy |
| Scheduled maintenance programs | Calendar-based servicing | Over-maintains healthy assets; can still miss early failures |
This project’s differentiators: a fully transparent supervised pipeline on public run-to-failure data, operator-grade alert metrics (lead time, false-positive rate), hysteresis-based alerting, and an explicit advisory-only, simulation-scoped boundary.
Technology Stack
- Python — the whole pipeline
- pandas / NumPy — time-series handling and rolling-window features
- scikit-learn / XGBoost or LightGBM — supervised degradation regression
- SQL database (SQLite/PostgreSQL) — predictions, alert states, and history
- matplotlib + scikit-learn metrics — evaluation and alert-quality analysis
- Streamlit or a small web app — the maintenance dashboard
Future Enhancements
- Sequence models (LSTM/Transformer) over raw windows instead of engineered features
- Regime-conditioned features keyed to operational settings
- Anomaly-detection ensemble as an early-warning layer feeding the supervised model
- Streaming ingestion with online scoring for live telemetry
- Fleet-level views: ranking assets by urgency across a whole site
Browse more Project Ideas · Intermediate Ideas