Smart Walking Route Planner with Air-Quality and Shade Scoring
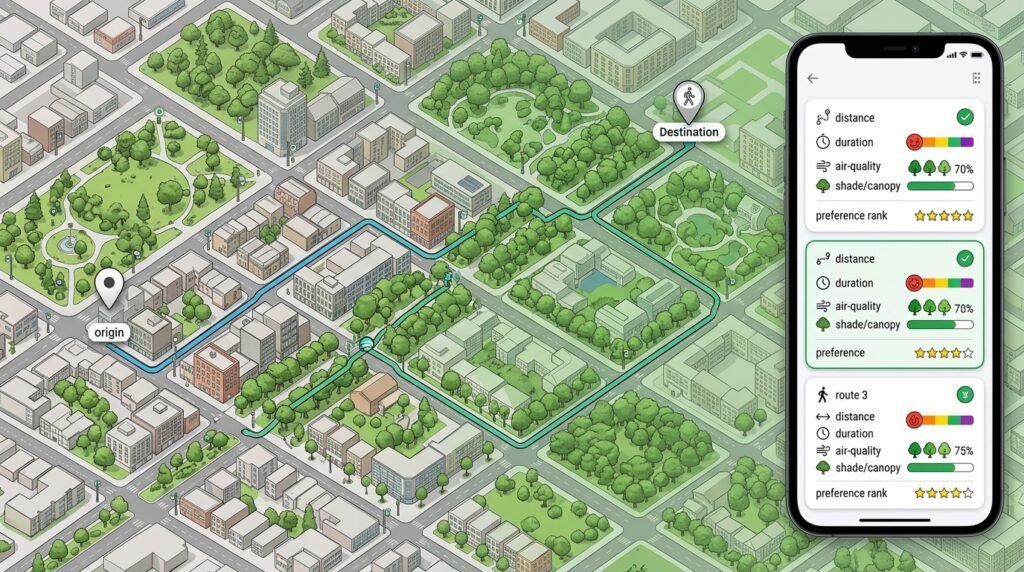
A consumer web app that compares walking routes between two points and scores them for comfort — lower pollution exposure and more shade — using open map data and public environmental feeds. Enter an origin and destination; the app fetches candidate walking routes, overlays air-quality measurements and tree-canopy information along each route geometry, and ranks the alternatives with a transparent, adjustable score. It is an informational route-preference tool: it helps a walker choose between options, and it is explicit that its environmental numbers are estimates from public data, not health guidance.
>Route preference, not health advice. The scores describe general environmental conditions along routes using public data of varying freshness and coverage. This tool does not diagnose, protect, or promise anything about health: it does not claim a route is medically safer, does not assess personal health risk, and cannot guarantee current air quality or shade anywhere. What it offers is a clearer picture of the choices a map app normally hides.
Who Is This For?
- Urban walkers and commuters who would trade two minutes of travel time for cleaner, shadier streets — if only they could see the trade
- Health- and comfort-conscious city dwellers choosing daily walking habits
- Developers who want a beginner-friendly geodata product: routing APIs, spatial overlays, and honest scoring
- Sustainability-minded makers building on open city data for everyday utility
The Problem
Walking is the healthiest, cheapest way through a city — but not all walking routes are equal. One street may be a shaded, tree-lined corridor; a parallel one may hug a busy arterial with measurably worse air. Standard map apps optimize for distance and time and are silent on everything else, so the walker never sees the choice they are making. Meanwhile, cities publish open environmental data — air-quality measurements, tree-canopy layers, urban-heat studies — and volunteer projects maintain a free, complete map of the world’s walkable streets. The pieces all exist. What’s missing is the consumer-grade connection: a small product that reads open routing data, layers public environmental signals on top, and shows a walker their options ranked by comfort instead of only by speed.
How It Works
The product is an orchestration of open data services with a scoring layer in the middle. Each stage is beginner-buildable with well-documented free APIs.
1. Get Candidate Routes
When a user enters an origin and destination, call a routing engine — OSRM (Open Source Routing Machine) is the standard choice, running as a free public demo API or self-hosted from OpenStreetMap data — and request several alternative walking routes, not just the fastest one. Each route comes back as a geometry (an ordered list of coordinates) plus distance and duration. The alternatives are the whole point: scoring one route is information, scoring two or three is a decision.
2. Overlay Environmental Data
Along each route’s geometry, fetch environmental signals:
- Air quality — from open feeds such as OpenAQ (aggregated public measurements) or established open air-quality index providers; values are typically reported per monitoring station or per modeled grid cell, with timestamps
- Shade/canopy — from open urban tree-canopy datasets or land-cover layers published by cities and environmental agencies; a tree canopy percentage per area is a proxy for shade, not a measurement of it
The overlay is a spatial-join exercise: for each segment of the route, find the environmental readings whose coverage area contains it. Keep it simple at first — buffer the route line, join intersecting zones — and accept that precision improves with geometry discipline later.
3. Score Each Route
Reduce each route’s environmental profile to two interpretable components:
- Exposure score — average and peak air-quality readings along the route, weighted toward the longest stretches (a kilometer beside a main road matters more than a crossing of one)
- Shade score — estimated canopy coverage along the route, acknowledging openly that this is derived from canopy-area proxies, not measured sunlight
Combine them with a distance/time penalty into a single transparent score — transparent meaning the formula is shown in the UI, the weights are user-adjustable, and nobody has to reverse-engineer why route B won.
4. Present the Decision
Show the ranked routes on a map with their environmental profiles: distance, time, exposure, shade, and the composite score. Let users drag weight sliders (“I care most about shade”) and watch the ranking re-sort — which is both the best UX feature and the most honest one, because it makes the subjectivity of the weighting visible and theirs.
5. Cache, Respect Limits, Stay Fresh
Environmental feeds and routing APIs have rate limits and update cycles. Cache route geometry and scoring results keyed by origin/destination/parameters, record the data timestamps alongside cached scores, and re-fetch environmental layers on a sensible schedule rather than per request. Staleness is a fact of public data: show when the air-quality readings were taken, and never pretend a cached value is a live measurement.
Key Features
- Multi-route comparison — alternatives ranked by comfort, not just speed
- Transparent scoring — visible formula, adjustable weights, per-component breakdown
- Air-quality overlay — readings from open feeds with data timestamps shown
- Shade estimation — canopy-derived scores explicitly labeled as estimates
- Map-first UI — routes drawn with color-coded environmental context
- Caching with staleness disclosure — every score carries the age of its underlying data
Functional Requirements
- Geocode origin/destination and fetch multiple walking routes from a routing engine
- Spatially join environmental readings and canopy coverage to route geometries
- Compute exposure and shade components with distance weighting; combine with user-adjustable weights
- Render ranked alternatives on an interactive map with per-route environmental profiles
- Cache routes and scores; expose data freshness on every displayed value
- Degrade gracefully: if an environmental feed is unavailable, show routes with that component marked “no data” rather than silently dropping it
User Stories
- As a commuter, I want to see a cleaner-air alternative route so I can decide whether two extra minutes are worth it.
- As a parent, I want shade information so I can pick the cooler walk on hot afternoons.
- As a user, I want to adjust what the score emphasizes so the ranking reflects my priorities, not a fixed formula.
- As a developer, I want the environmental overlay modular so I can swap data sources per city.
- As a curious walker, I want to see when the air-quality readings were taken so I know how much to trust them.
MVP Scope
A minimal but complete MVP:
Origin/destination input → 2–3 walking alternatives from OSRMOne air-quality feed and one canopy/land-cover layer joined to route geometriesExposure and shade components with a fixed, documented default weighting plus a distance/time penaltyRanked routes on a map with per-component scores and data timestampsSimple weight sliders that re-rank routes client-sideExplicitly out of MVP: user accounts, saved routes, live sensor integration, elevation/heat modeling, and mobile apps. All are natural extensions.
Project Timeline
- Week 1: routing integration, route geometry handling, basic map rendering
- Week 2: environmental data joins, exposure and shade scoring
- Week 3: UI polish, weight sliders, caching and freshness disclosure
- Week 4: graceful degradation, testing across cities, launch prep
Testing Strategy
- Data tests: every route segment maps to an environmental zone or is explicitly marked “no data”; scores recompute correctly when weights change
- API tests: routing and environmental clients handle rate limits and timeouts with backoff; cached responses respect their recorded timestamps
- UI tests: rankings update live under slider changes; “no data” components render honestly instead of as zeros
- City tests: the pipeline runs end to end in at least three cities with different data coverage, including one with sparse environmental data
- Sanity tests: a route along a park scores better on shade than a parallel route along a highway, given equivalent coverage data
Security and Privacy Considerations
- Location is sensitive. An origin/destination pair can reveal home, workplace, or a child’s school. Minimize retention: process routes in memory, keep no precise route history by default, and if analytics are ever added, aggregate to the level of city districts — never store identifiable movement patterns.
- Third-party API calls necessarily see the queried locations; document which services receive what data and choose providers accordingly.
- Show environmental data with its sources and timestamps so users can judge freshness themselves — transparency is also a trust feature.
- No health claims anywhere in the product: no route is “safe for asthma,” no air level is “harmless.” The tool ranks preferences; it does not assess medical risk.
Success Metrics
- A working end-to-end planner in at least three cities, including one with sparse environmental coverage
- Every displayed score traceable to its component data and timestamp in the UI
- Weight sliders re-rank routes within a second on cached routes
- Graceful “no data” behavior verified by disabling each environmental feed
- Zero retained precise route histories in the default configuration
Common Challenges
- Environmental coverage gaps — monitoring stations and canopy layers are uneven; honest “no data” handling is a core feature, not an edge case
- Stale measurements — air-quality readings lag reality; timestamps on every value keep the product trustworthy
- Shade is a proxy — canopy percentage approximates shade; it varies with sun angle, season, and building shadows that public data rarely captures
- Weighting subjectivity — any composite score embeds choices; adjustable, visible weights turn that from a hidden bias into a user control
- API limits and costs — routing and environmental feeds rate-limit; caching design determines whether the product survives its first traffic spike
- Routing-data limitations — OSM pedestrian data quality varies by city; sidewalk and crossing completeness affects route realism
Learning Objectives
- Orchestrate multiple open-data services (routing, environmental feeds, canopy layers) into one product
- Work with route geometries and spatial joins — the fundamental geodata skill
- Design transparent scoring systems with visible, adjustable weights
- Handle real-world data realities: coverage gaps, staleness, and rate limits, all surfaced honestly
- Build a privacy-respecting location product that minimizes retention by default
Why This Idea Is Different
This project consumes environmental data; it does not produce forecasts. The Air Quality Prediction & Pollution Hotspot Mapper is an analysis project: it predicts air-quality values and maps pollution hotspots for monitoring audiences. #060 is a consumer decision product: it takes available air-quality readings as one input, adds shade and distance, and ranks walking routes for an individual choosing a path today. Different output (ranked route options vs pollution maps), different audience (pedestrians vs environmental-data builders), different stack (routing and geodata overlay in JavaScript vs ML time-series work in Python). It shares the location-intelligence spirit of the Location-Based Reminder App with Geofencing — practical consumer geography — but answers a different question: not “remind me when I arrive,” but “which way should I walk?” Both, notably, are built on the same open OSM foundation.
| Tool type | Approach | Limitation |
|———–|———-|————|
| Mainstream map apps | Fastest/shortest routing | Silent on pollution and shade; no comfort trade-offs visible |
| Cycling route planners with pollution layers | Exposure-aware bike routing | Bike-focused; walking networks and speeds differ |
| City open-data dashboards | Environmental layers on maps | Exploratory maps, not decision tools tied to a specific trip |
| Air-quality alert apps | Location-based pollution notifications | Notify about conditions; do not compare route alternatives |
This project’s differentiators: a walking-specific, decision-oriented product on fully open data, transparent adjustable scoring, honest staleness and “no data” handling, and a privacy-minimal design.
Technology Stack
- JavaScript — application logic and UI
- Leaflet (or MapLibre) — interactive map rendering
- OSRM public API (or self-hosted) — walking route geometry
- OpenAQ / open AQ-index feeds — air-quality readings with timestamps
- City canopy / land-cover open layers — shade proxies
- SQLite or a small document store — route and score caching
- Node.js (optional lightweight backend) — caching and API-key handling away from the browser
Future Enhancements
- Elevation-aware comfort scoring (uphill exposure matters differently)
- Seasonal shade modeling from sun-position and building-height data
- City plug-in architecture so communities contribute local data layers
- Shareable route cards with the environmental breakdown embedded
- Accessibility-aware scoring: curb cuts, shade rest points, and bench density for walkers who need them
Browse more Product Ideas · Beginner Ideas