Dynamic Pricing Simulator for Sellers
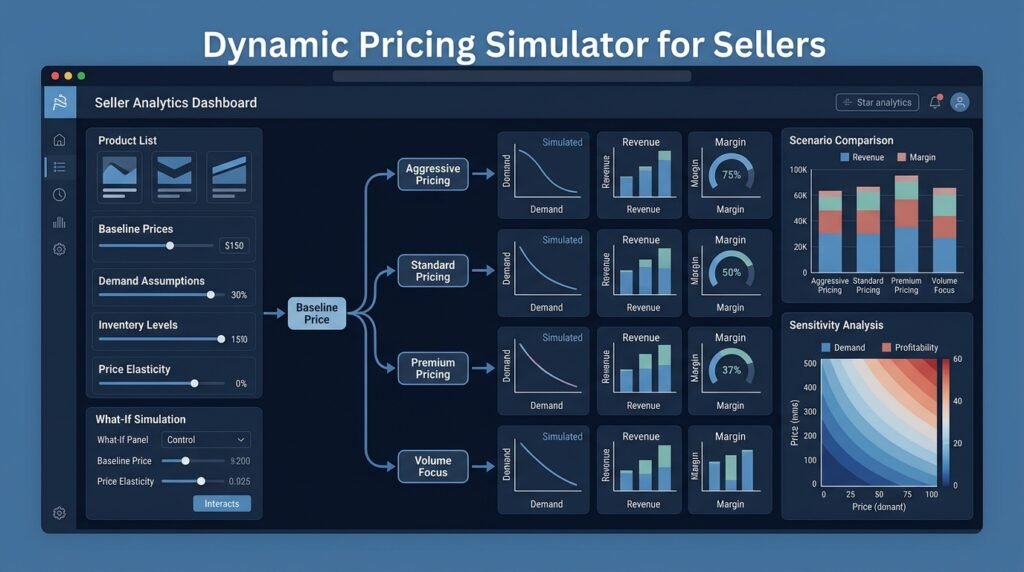
A what-if simulator for small e-commerce sellers: upload your own sales history, describe candidate pricing strategies (a flat discount, a competitor-matching rule, a seasonal repricing band), tune the demand assumptions, and the tool replays the data under each strategy to show simulated revenue, units, and margin side by side. It is a spreadsheet-sized decision-support tool with honest modeling — every output is labeled a scenario, not a prediction.
>Simulation is not a guarantee. Every result depends on the demand assumptions you supply, and historical relationships do not reliably predict the future. This tool never claims a strategy will increase revenue or profit, and it is not business advice — it is a transparent way to explore “what if” before risking real inventory.
Who Is This For?
- Marketplace sellers and small retailers who price by gut feel and want to test ideas on their own data
- E-commerce students learning demand modeling, elasticity, and scenario analysis
- Developers who want a clean simulation project: a data model, a pluggable pricing-rules engine, and honest reporting
- Product people evaluating pricing experiments before committing
The Problem
Sellers change prices by instinct because the alternatives are enterprise price-optimization platforms (expensive, opaque) or spreadsheets that can’t model interactions — how does a 10% discount affect unit velocity? What if I match a competitor’s price band? What happens to margin if demand is more elastic than I guessed? The missing tool is a simulation sandbox: deterministic replay of the seller’s own history under clearly-labeled assumptions, with scenario comparison that shows the sensitivity of the answer to those assumptions.
How It Works
1. Upload Sales History
The seller imports their own transaction history (SKU, date, units, price, optional cost). The tool validates the schema, stores it locally, and derives baseline per-SKU facts: average price, unit velocity, and any simple seasonal pattern in the data.
2. Describe a Pricing Strategy
A strategy is a set of rules the seller defines in plain language: “discount product A by 10% every Friday,” “keep price within 5% of the competitor band for product B,” “raise price 15% in December.” Rules can target SKUs, categories, or the whole catalog and can depend on simulated values (for example, stock level).
3. Set Demand Assumptions
For each SKU or category, the seller sets the model’s assumptions: a price elasticity estimate (how units respond to price changes) and optional inventory constraints (stock-outs cut off sales). The tool is explicit that these are assumptions the seller supplies — it never invents an elasticity silently, and a “sensitivity” toggle shows what happens if elasticity is 1.5× or 0.5× the estimate.
4. Replay and Compare
The simulator walks the history day by day under the strategy, applying rules and demand responses to compute simulated units, revenue, and margin per SKU and in total. Every number is labeled “simulated under assumptions X, Y, Z,” and the baseline (no strategy) is always shown alongside, so the seller sees the delta — not an absolute promise.
5. Visualize Sensitivity
Scenario tables and simple charts compare baseline vs strategy vs strategy-with-different-elasticity. The sensitivity view is the honest core: if the conclusion flips when elasticity shifts, the tool says so in plain language (“this result depends heavily on your elasticity assumption”).
Key Features
- Schema-validated history import — CSV with clear error messages
- Pluggable pricing-rules engine — discount, repricing band, seasonal, inventory-aware rules
- Explicit demand assumptions — per-SKU elasticity, optional inventory caps, all labeled as user-supplied
- Scenario comparison — baseline vs strategy, units/revenue/margin, totals and per-SKU
- Sensitivity analysis — elasticity multipliers that show how fragile a result is
- Honest labeling — every output is marked “simulated” with the assumption set it used
Functional Requirements
Import seller-supplied sales history (SKU, date, units, price, optional cost) with validation and clear errors.Define strategies as rule sets over SKUs/categories with configurable parameters.Model demand response per SKU using a user-supplied elasticity estimate; apply optional inventory caps.Replay history under each strategy and produce per-SKU and total simulated units, revenue, and margin, always alongside the baseline.Compute sensitivity by re-running with elasticity multipliers (for example, 0.5×/1×/1.5×) and flag results that flip direction.Export scenario tables for the seller’s own analysis.User Stories
- As a marketplace seller, I want to see what a Friday 10% discount would have done to my last quarter’s units and revenue, so that I can decide whether to try it — without risking real inventory.
- As a seller, I want the tool to tell me my elasticity estimate is doing the heavy lifting, so that I don’t mistake an assumption for a fact.
- As an e-commerce student, I want to change an elasticity and watch the scenario flip, so that I understand how demand modeling drives pricing decisions.
- As a developer, I want the rules engine pluggable and the replay deterministic, so that scenarios are reproducible and testable.
MVP Scope
CSV import with validation; local storage of history.Three rule types: fixed discount, price-band targeting, seasonal price change.Linear-demand replay with user-supplied elasticity and optional inventory caps.Baseline-vs-strategy comparison tables and a simple chart.Elasticity sensitivity toggle with direction-flip warnings.Rule chaining, competitor-feed simulation, category-level seasonality fitting, and a recommendation engine are natural second-phase additions.
Project Timeline
- Phase 1 — Import and data model (Week 1): CSV validation, storage schema, per-SKU baseline derivation.
- Phase 2 — Rules engine (Weeks 2–3): Rule DSL/UI, strategy application, and deterministic day-by-day replay.
- Phase 3 — Demand modeling (Week 4): Elasticity application, inventory caps, and the assumption set that travels with every result.
- Phase 4 — Comparison + sensitivity (Week 5): Scenario tables, charts, elasticity multipliers, and direction-flip warnings.
- Phase 5 — Polish (Week 6): Export, docs, and a pilot with the seller’s own anonymized data.
Testing Strategy
- Replay determinism — the same history + strategy + assumptions produce byte-identical results every run.
- Elasticity math — known unit/price pairs assert exact simulated units at elasticity 0 (no response) and 1 (proportional).
- Inventory-cap tests — stock-outs truncate sales correctly; negative inventory never occurs.
- Rule tests — each rule type applies only to its targets and respects date/price conditions.
- Sensitivity tests — direction-flip detection fires exactly when the sign of the delta changes across multipliers.
- Import tests — malformed rows produce actionable errors and no partial writes.
Security and Privacy Considerations
- Seller data is business data. History is stored locally by default; if the app is hosted, access control and at-rest encryption apply, and the seller can export/delete everything.
- No fabricated market statistics. The tool uses only the seller’s own history and their explicit assumptions; it never injects external market claims into results.
- Assumption transparency. Every scenario output names its assumption set (elasticity, caps, rule parameters) — results without assumptions are considered a bug.
- No business/financial advice. The tool is decision support: it shows simulated outcomes under stated assumptions and explicitly says outcomes are not guaranteed and historical relationships may not hold.
- Anonymization for demos. Example data in docs and screenshots is clearly fictional or anonymized.
Success Metrics
- A pilot seller imports their own history and completes a scenario comparison in one session without support.
- Replay determinism holds across all tests; sensitivity warnings fire on at least one realistic flipped scenario.
- Assumption labeling: every report page carries the assumption set; reviewers confirm no “naked” numbers exist.
- Honest-outcome audit: the tool never produces a revenue/profit guarantee string in any output.
Common Challenges
- Elasticity uncertainty — estimates are guesses; the sensitivity view exists precisely because of this, and the tool refuses to present a single point estimate as truth.
- Seasonality — naive replay ignores future regime changes; the MVP only replays history and documents that limitation rather than forecasting.
- Rule interactions — two rules on one SKU can conflict; a deterministic precedence order (later rule wins, with a warning) keeps behavior understandable.
- Spreadsheet skepticism — sellers trust their own math; the tool earns trust by showing per-SKU math and matching the baseline replay to the actuals exactly.
- Scope creep toward price optimization — optimizing is a different, harder problem; this project is a simulator, and it says so.
Learning Objectives
- Implement deterministic simulation/replay over real-world transaction data.
- Understand price elasticity and demand modeling — including how assumptions drive conclusions.
- Design a pluggable rules engine with clean precedence semantics.
- Build honest decision-support UX: labeled outputs, sensitivity views, and no guarantee language.
- Practice data hygiene: validation, local-first storage, export/delete, and anonymized examples.
Why This Idea Is Different
This project is deliberately the pricing-decision sibling of the site’s Inventory Forecasting for Small E-commerce, not a duplicate: the forecasting tool predicts future inventory and demand requirements from historical patterns, while this simulator experiments with hypothetical pricing strategies — what would have happened, or what could happen under stated assumptions, if prices changed. Forecasting answers “how much will we need?”; this tool answers “what if we price differently?” — a what-if simulation, not a forecasting system. It completes the small-retailer suite alongside the AI Product Recommendation Engine for Small Retailers (which recommends products to buyers) and the E-commerce Product Review Sentiment Analyzer (which reads buyer feedback) — together they give a seller demand, pricing, and voice-of-customer tooling built on their own data.
| Tool type | Approach | Limitation |
|———–|———-|————|
| Spreadsheet modeling | Manual what-if in Excel | No structure; errors hidden in formulas |
| Enterprise price optimization | ML pricing recommendations | Expensive, opaque, assumes data scale |
| Marketplace repricing tools | Auto-adjust to competition | No simulation of the seller’s own history |
| A/B price testing | Real experiments on live traffic | Costs real sales; slow; needs traffic |
This project’s differentiators: deterministic replay of the seller’s own history, fully visible demand assumptions, sensitivity analysis that exposes fragility, and an explicit simulation-not-prediction boundary.
Technology Stack
- Python — replay engine, rules, and reporting
- SQLite/PostgreSQL — history and scenario storage
- Web UI (Streamlit or FastAPI + simple frontend) — import, strategy definition, charts
- pandas — data validation and aggregation
- pytest — determinism and math tests
- CSV export — seller-facing data portability
Future Enhancements
- Rule chaining and precedence visualization
- Category-level seasonality fitting from the seller’s own data
- “What-if competitor price feed” scenario (seller-supplied competitor prices)
- Scenario versioning and change history
- Optional margin/cost modeling per SKU with clearer P&L scenarios
Browse more Startup Ideas · Intermediate Ideas